Explore records#
If you want to explore your dataset or analyze the predictions of a model, the Rubrix web app offers a dedicated Explore mode. The powerful search functionality and intuitive filters allow you to quickly navigate through your records and dive deep into your dataset. At the same time, you can view the predictions and compare them to gold annotations.
You can access the Explore mode via the sidebar of the Dataset page.
Search and filter#
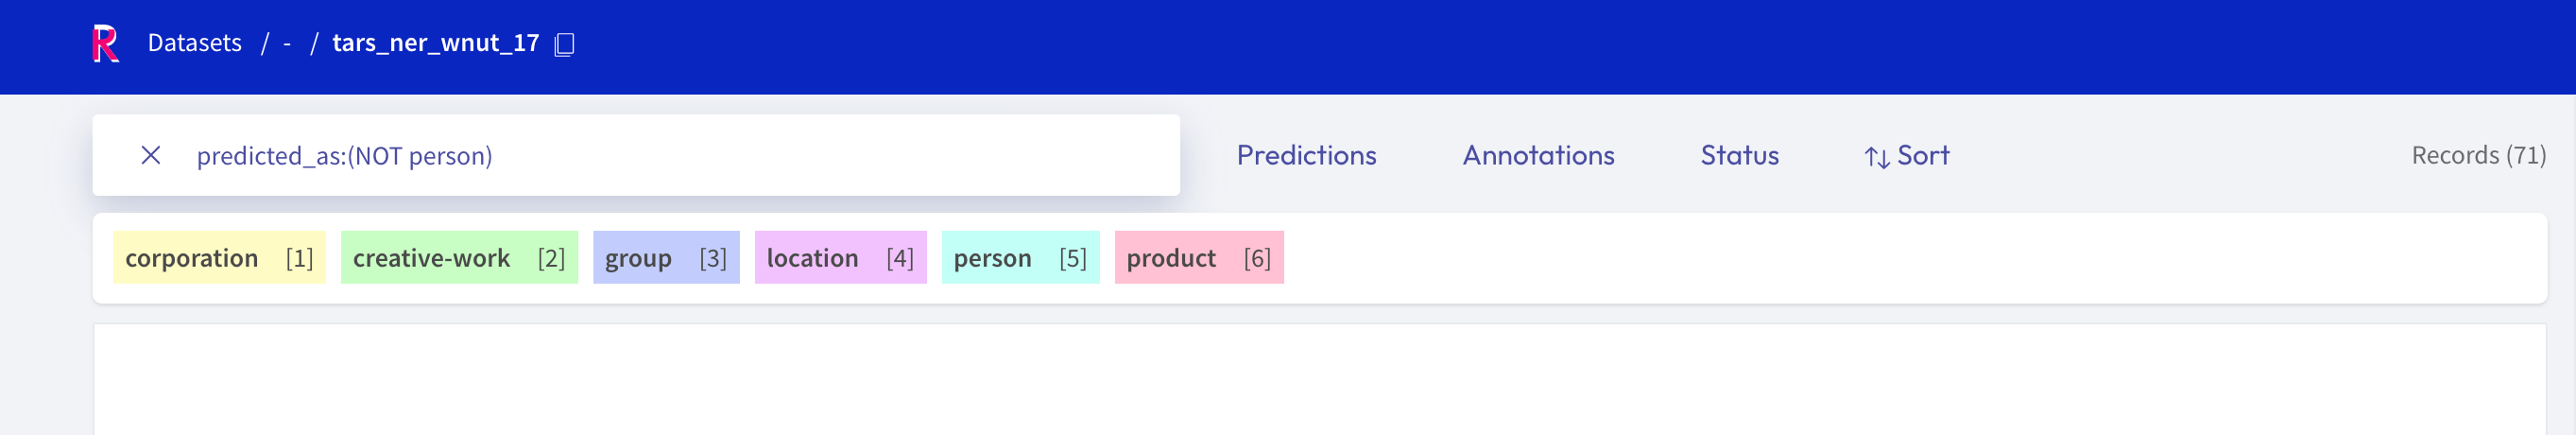
The powerful search bar allows you to do simple, quick searches, as well as complex queries that take full advantage of Rubrix’s data models. In addition, the filters provide you a quick and intuitive way to filter and sort your records with respect to various parameters, including predictions and annotations. Both of the components can be used together to dissect in-depth your dataset, validate hunches, and find specific records.
You can find more information about how to use the search bar and the filters in our detailed search guide and filter guide.
Note
Not all filters are available for all tasks.
Predictions and annotations#
Predictions and annotations are an integral part of Rubrix’s data models. The way they are presented in the Rubrix web app depends on the task of the dataset.
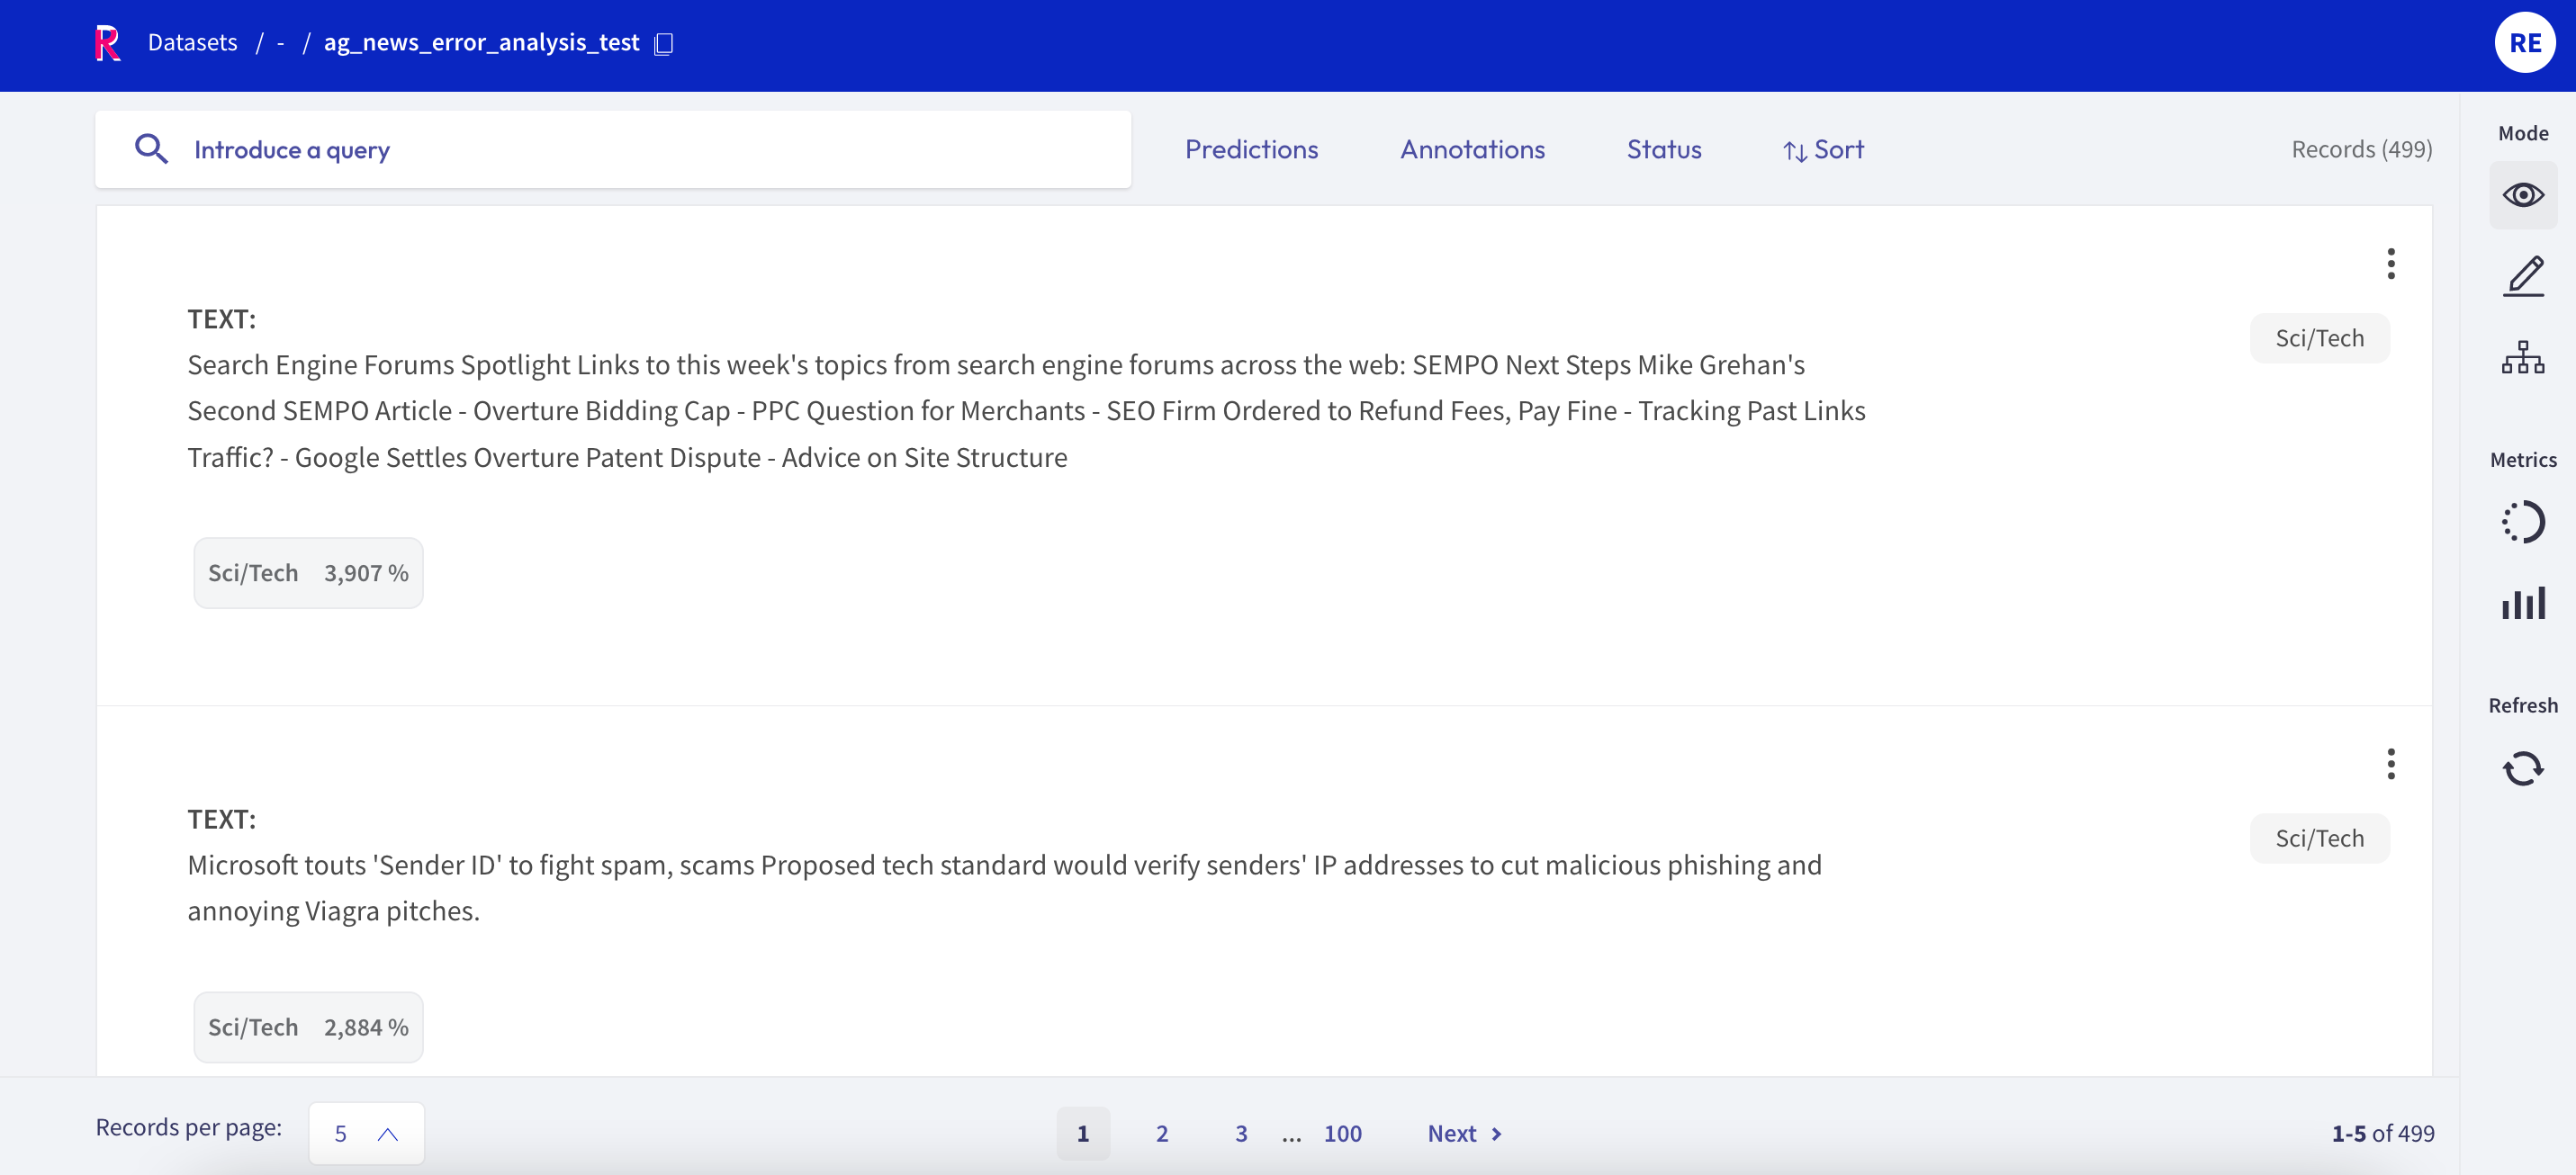
Text classification#
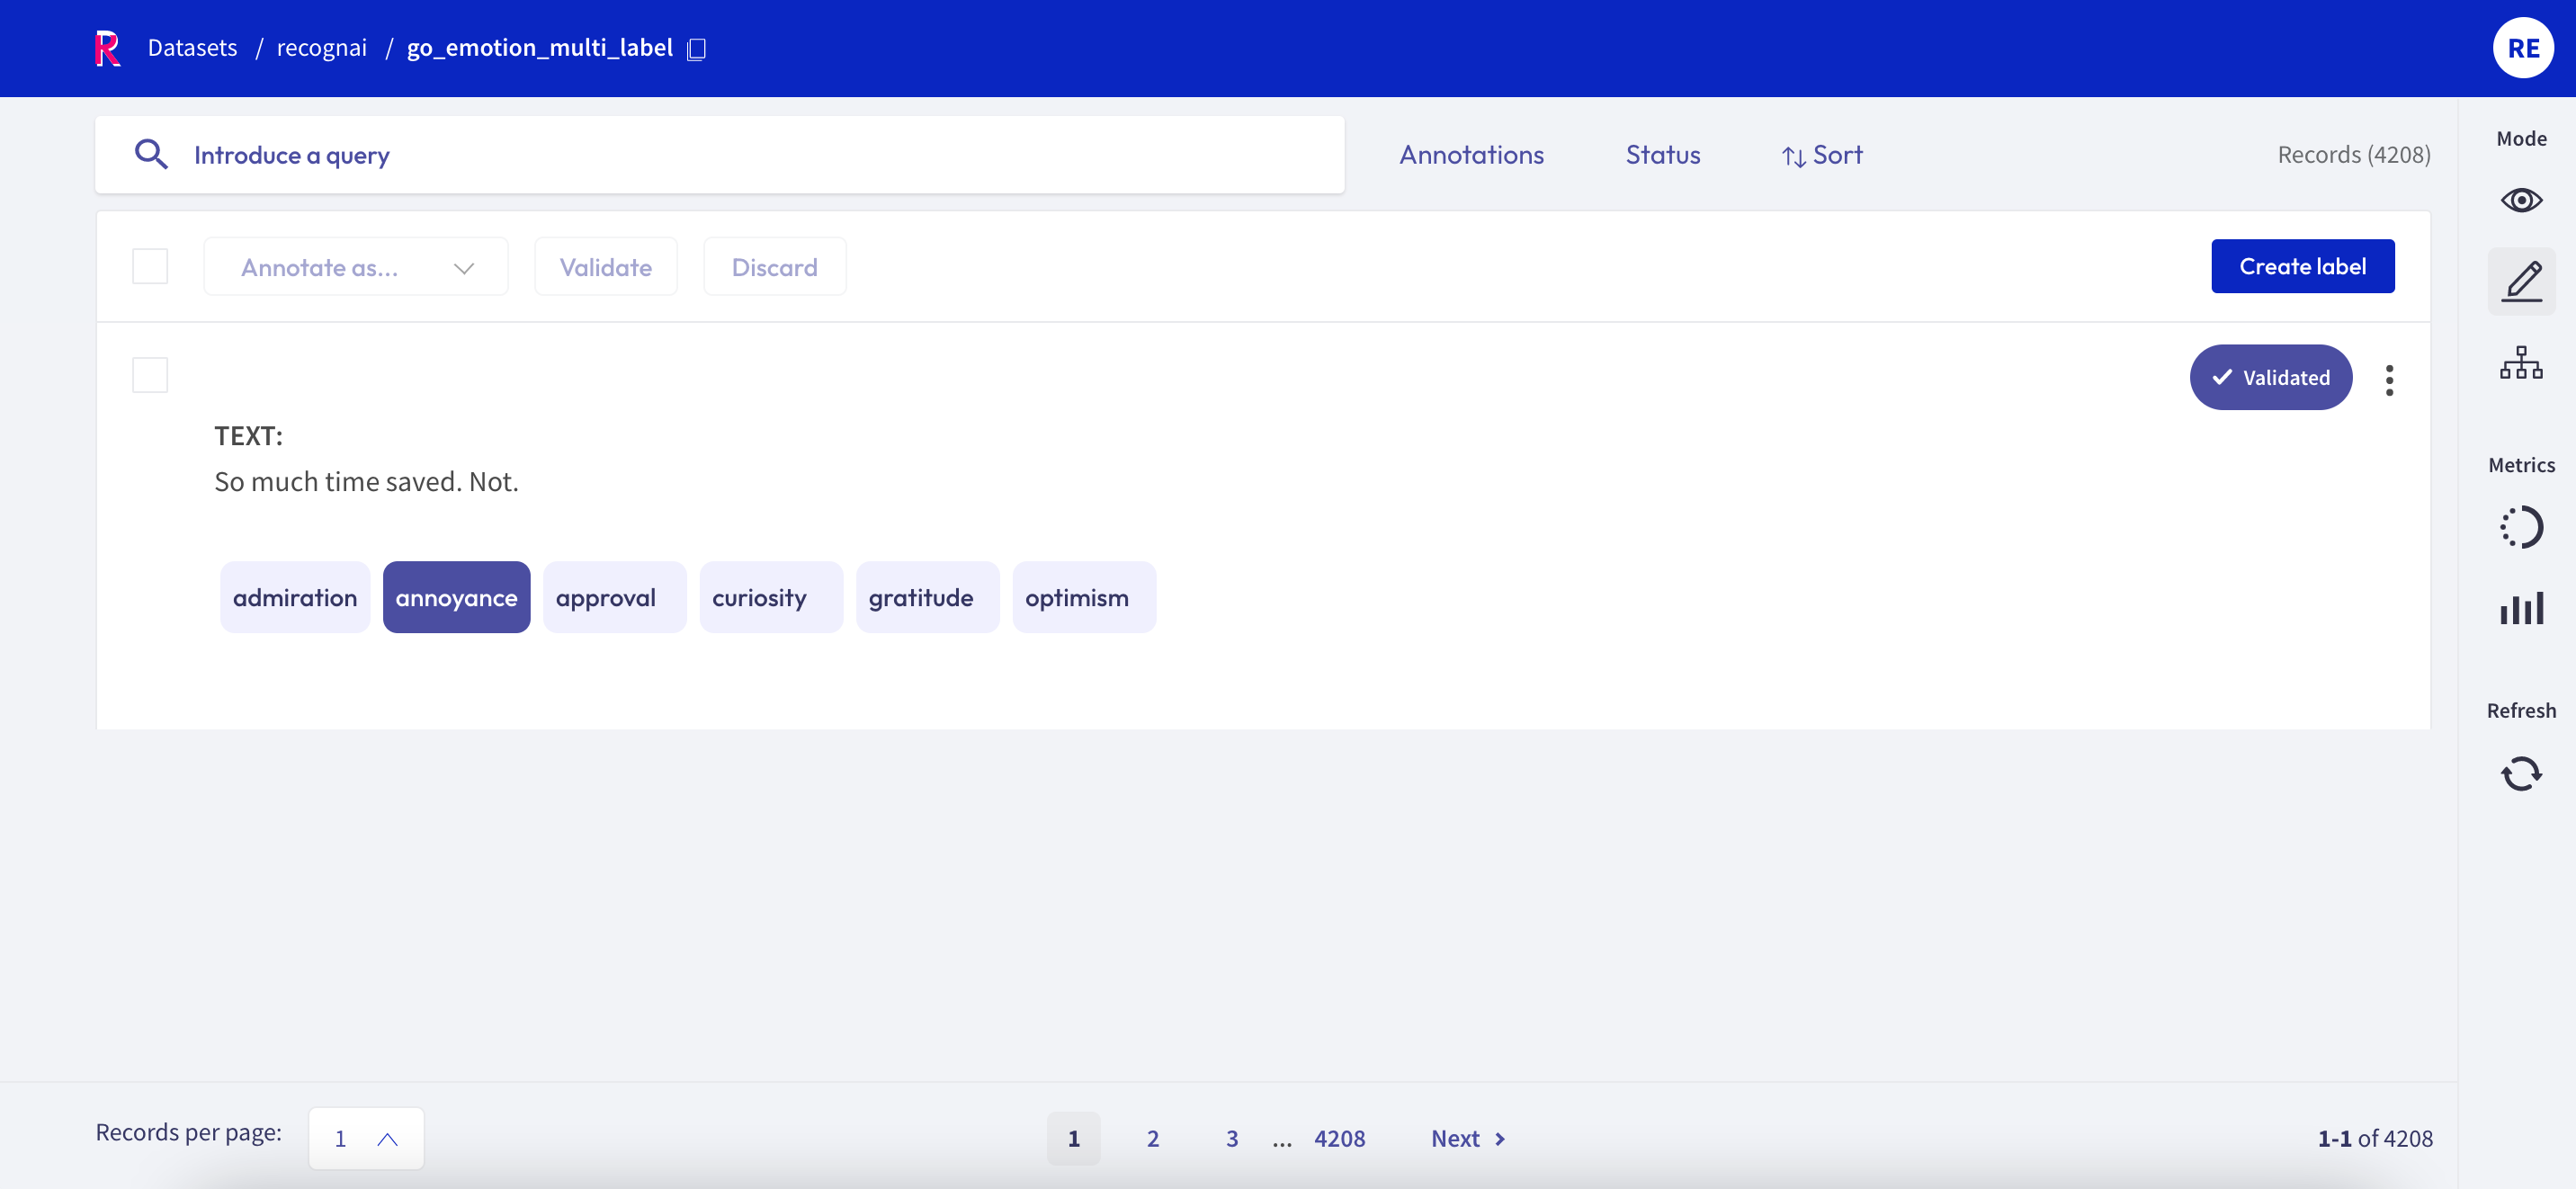
In this task the predictions are given as tags below the input text. They contain the label as well as a percentage score. Annotations are shown as tags on the right together with a symbol indicating if the predictions match the annotations or not.
Token classification#
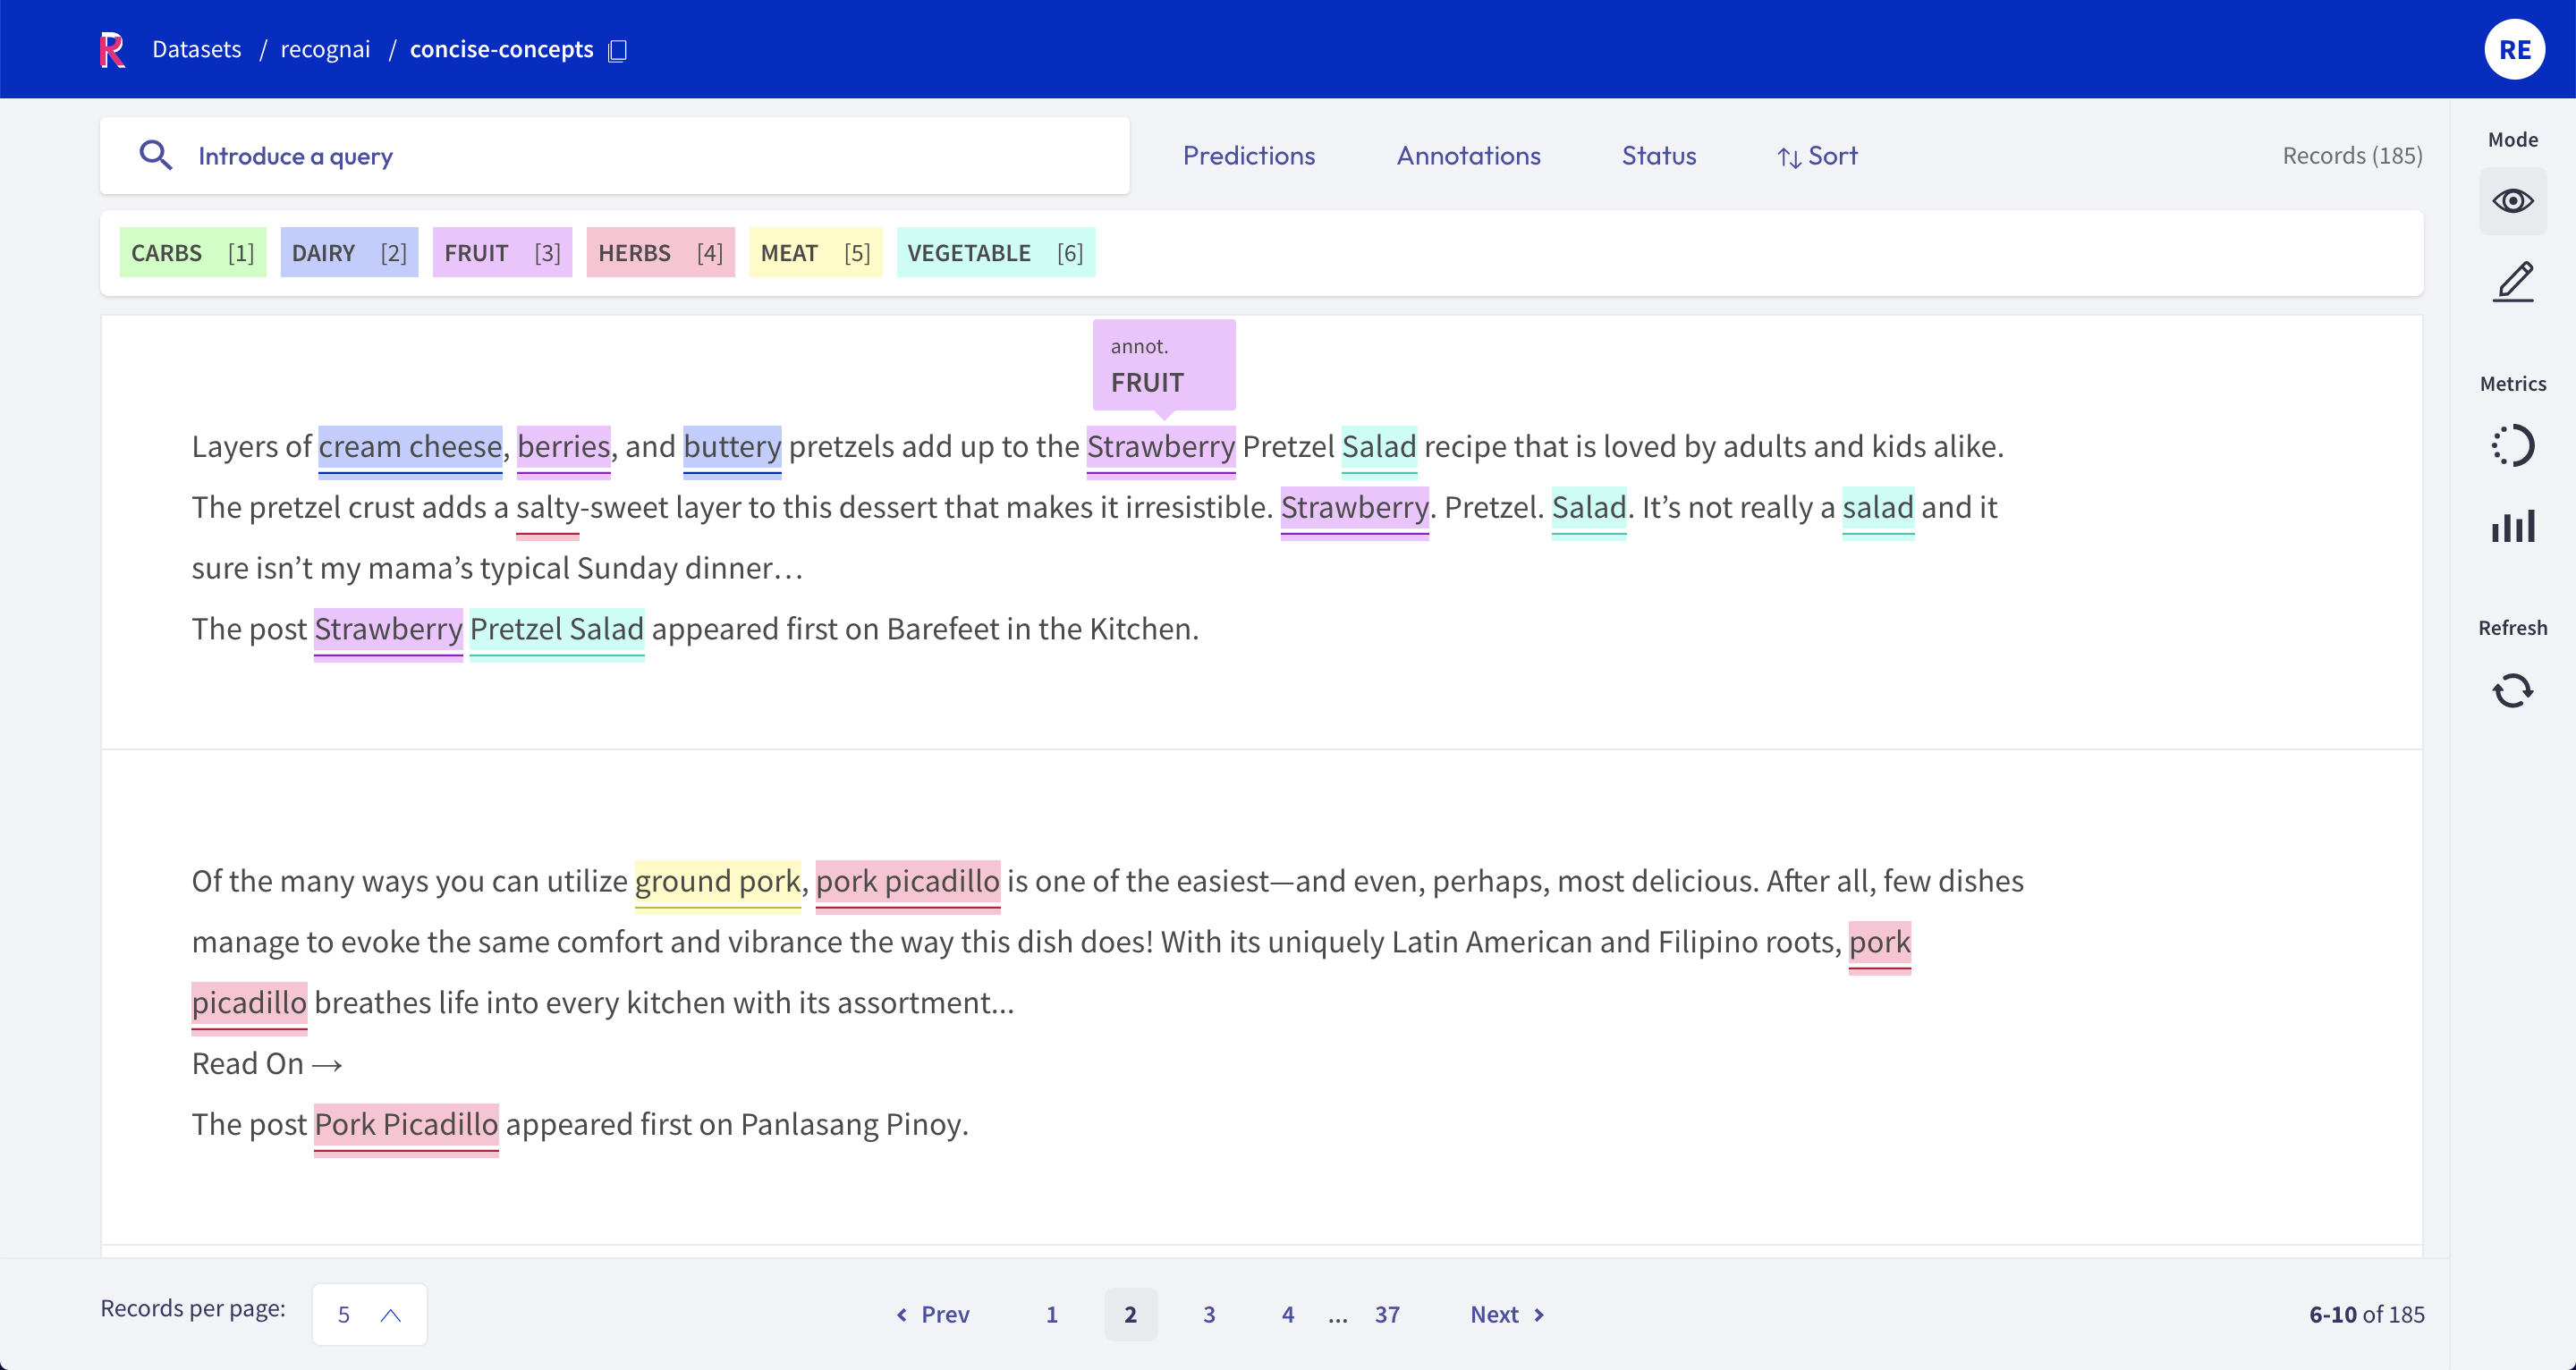
In this task, predictions and annotations are displayed as highlights in the input text. To easily identify them at a glance, annotations are highlighted with the color of their corresponding label, while predictions are underlined with a solid line (see picture).
For datasets with available score, the solid line for predictions disappears when the score filter (in Predictions filter section) is applied.
Text2Text#
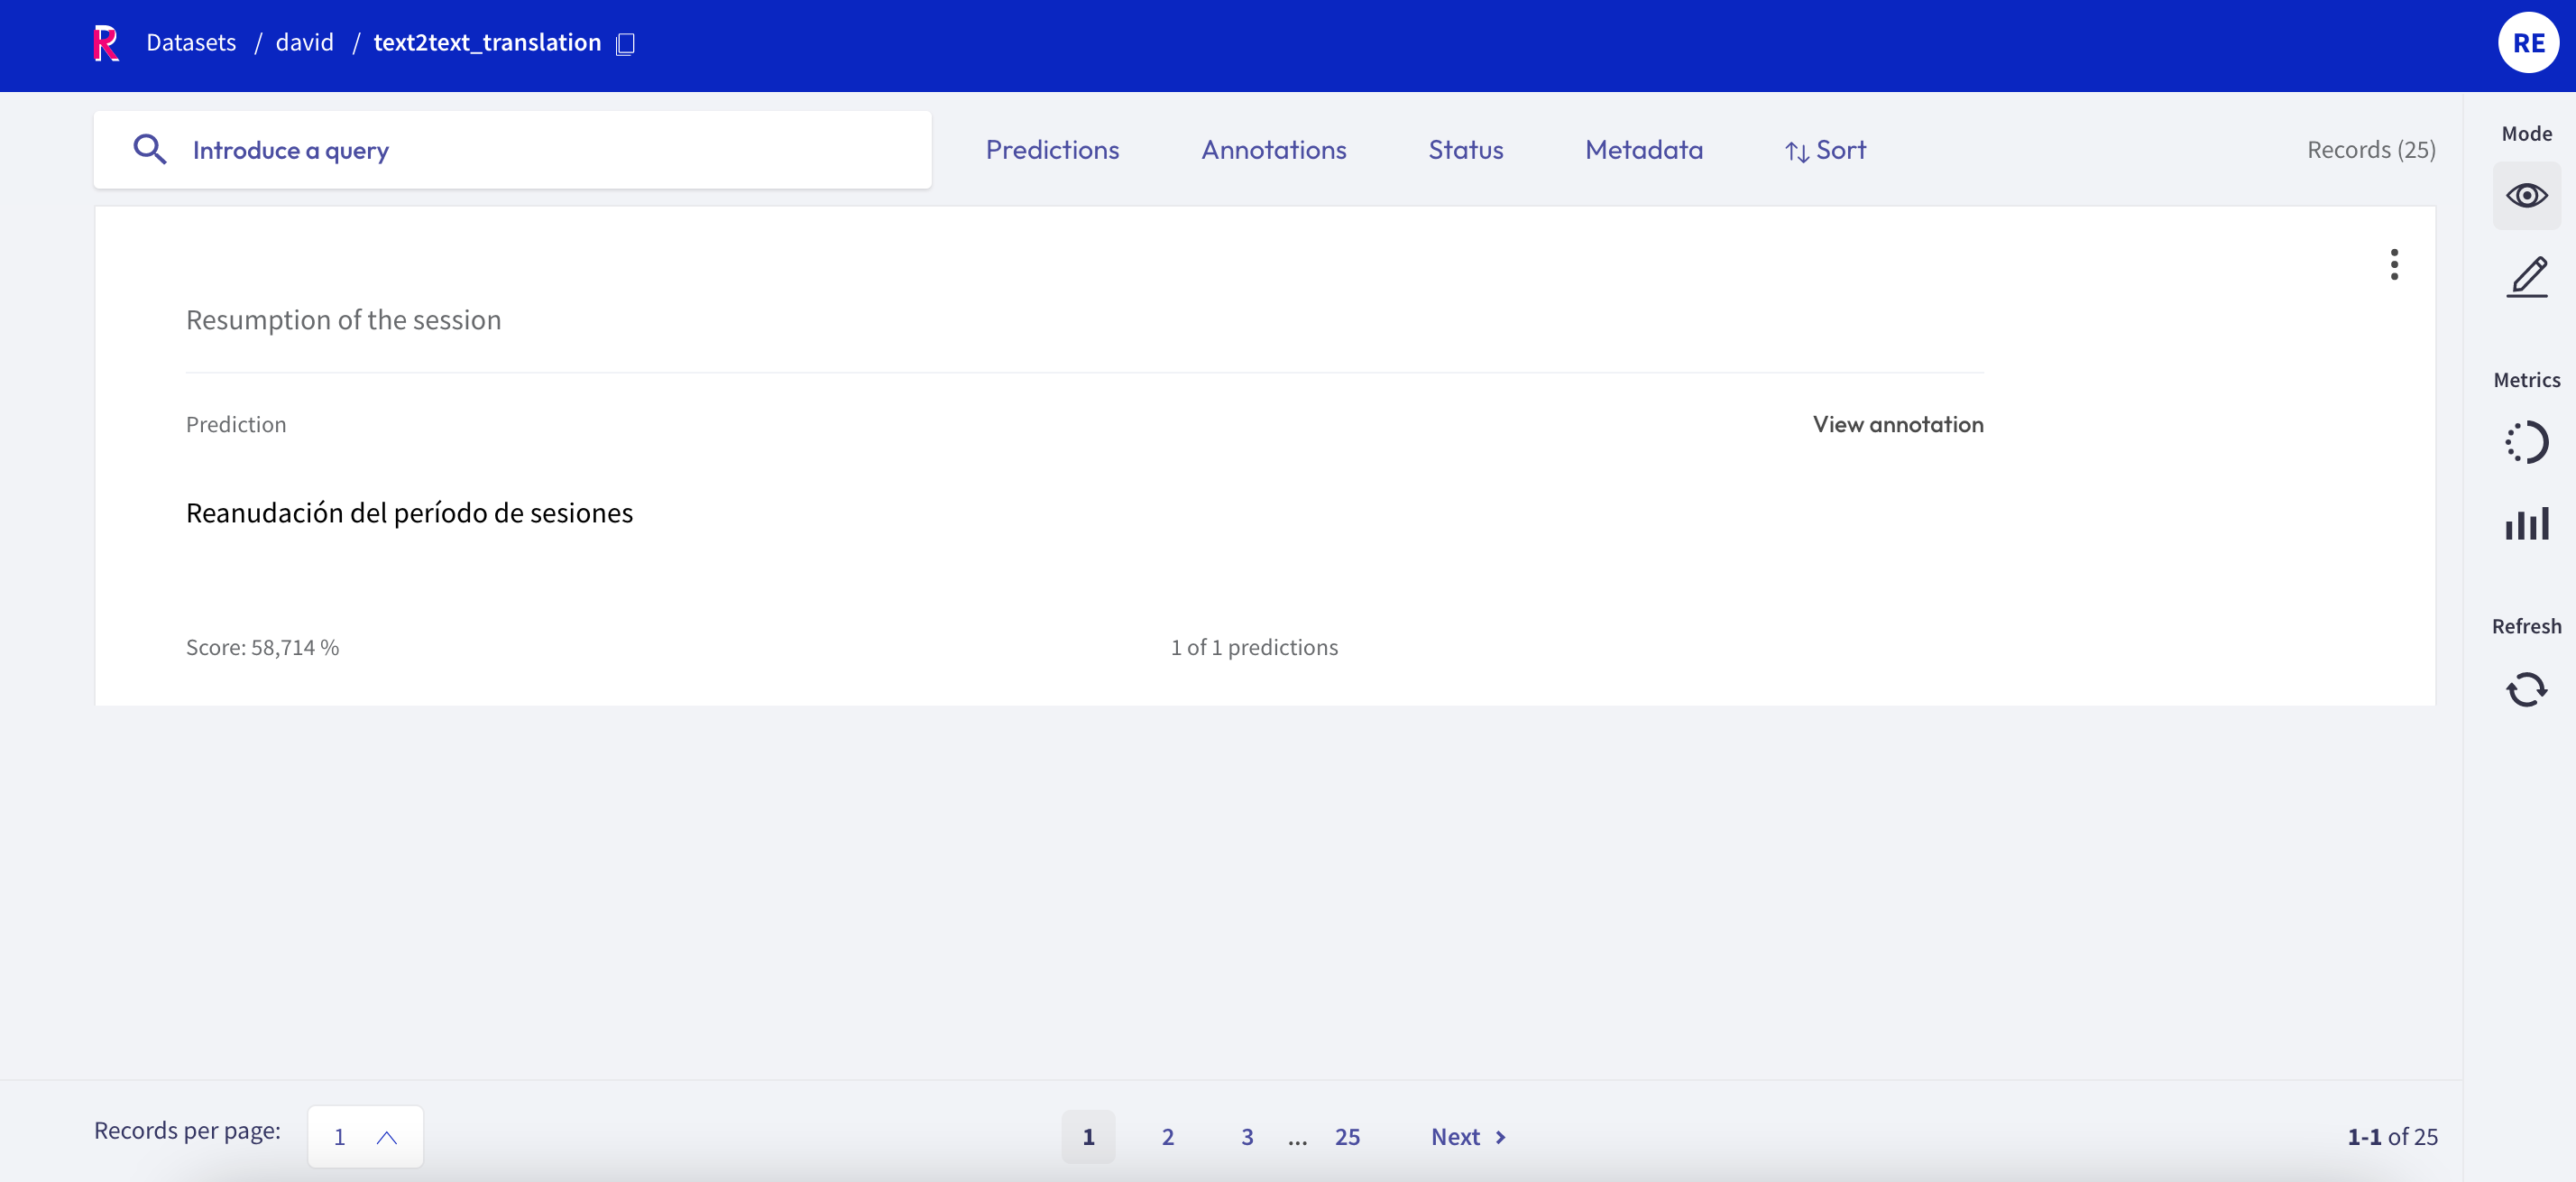
In this task predictions and the annotation are given in a text field below the input text. You can switch between prediction and annotation via the “View annotation”/”View predictions” buttons. For the predictions you can find an associated score in the lower left corner. If you have multiple predictions you can toggle between them using the arrows on the button of the record card.
Metrics#
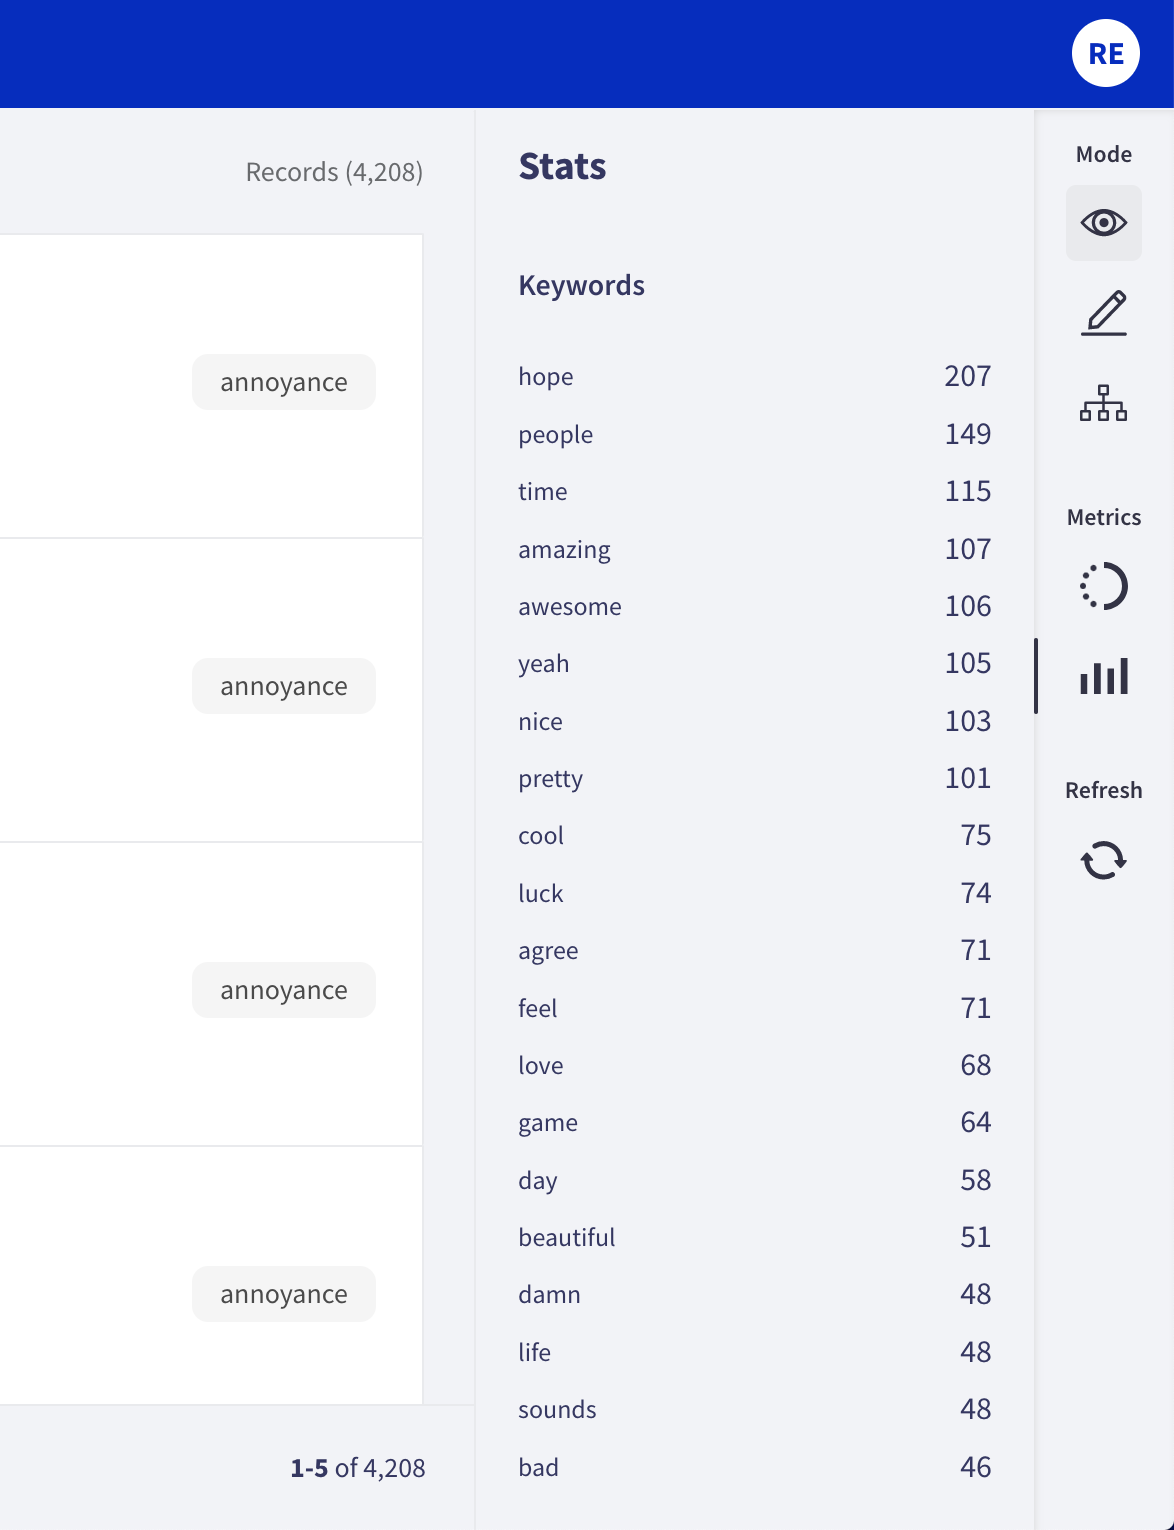
From the side bar you can access the Stats metrics that provide support for your analysis of the dataset.