Dataset#
The Dataset page is the main page of the Rubrix web app. From here you can access most of Rubrix’s features, like exploring and annotating the records of your dataset.
The page is composed of 4 major components:
Search bar#
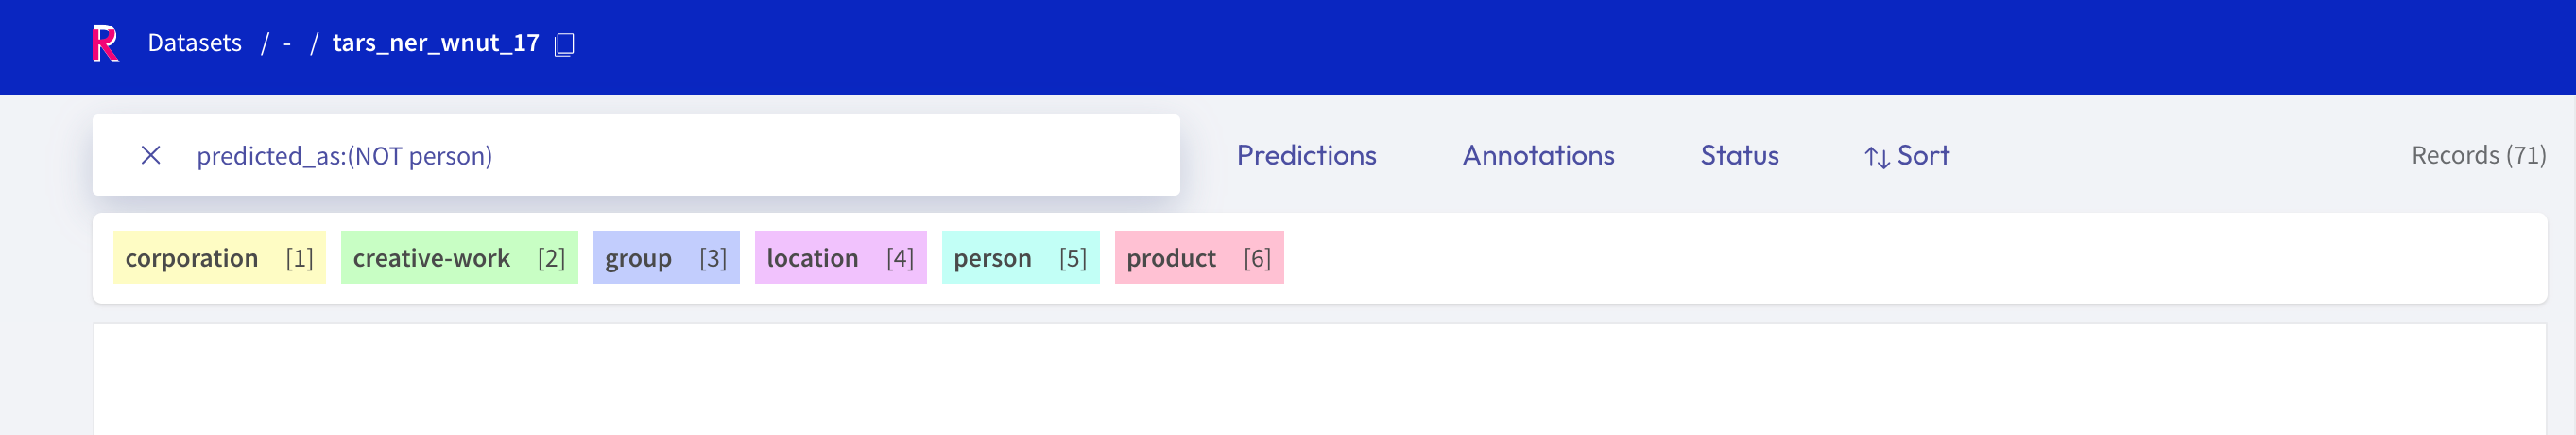
Rubrix’s search bar is a powerful tool that allows you to thoroughly explore your dataset, and quickly navigate through the records. You can either fuzzy search the contents of your records, or use the more advanced query string syntax of Elasticsearch to take full advantage of Rubrix’s data models. You can find more information about how to use the search bar in our detailed search guide.
Filters#

The filters provide you a quick and intuitive way to filter and sort your records with respect to various parameters. You can find more information about how to use the filters in our detailed filter guide.
Record cards#
The record cards are at the heart of the Dataset page and contain your data. There are three different flavors of record cards depending on the task of your dataset. All of them share the same basic structure showing the input text and a vertical ellipsis (or “kebab menu”) on the top right that lets you access the record’s metadata. Predictions and annotations are shown depending on the current mode and task of the dataset.
Check out our exploration and annotation guides to see how the record cards work in the different modes.
Text classification#
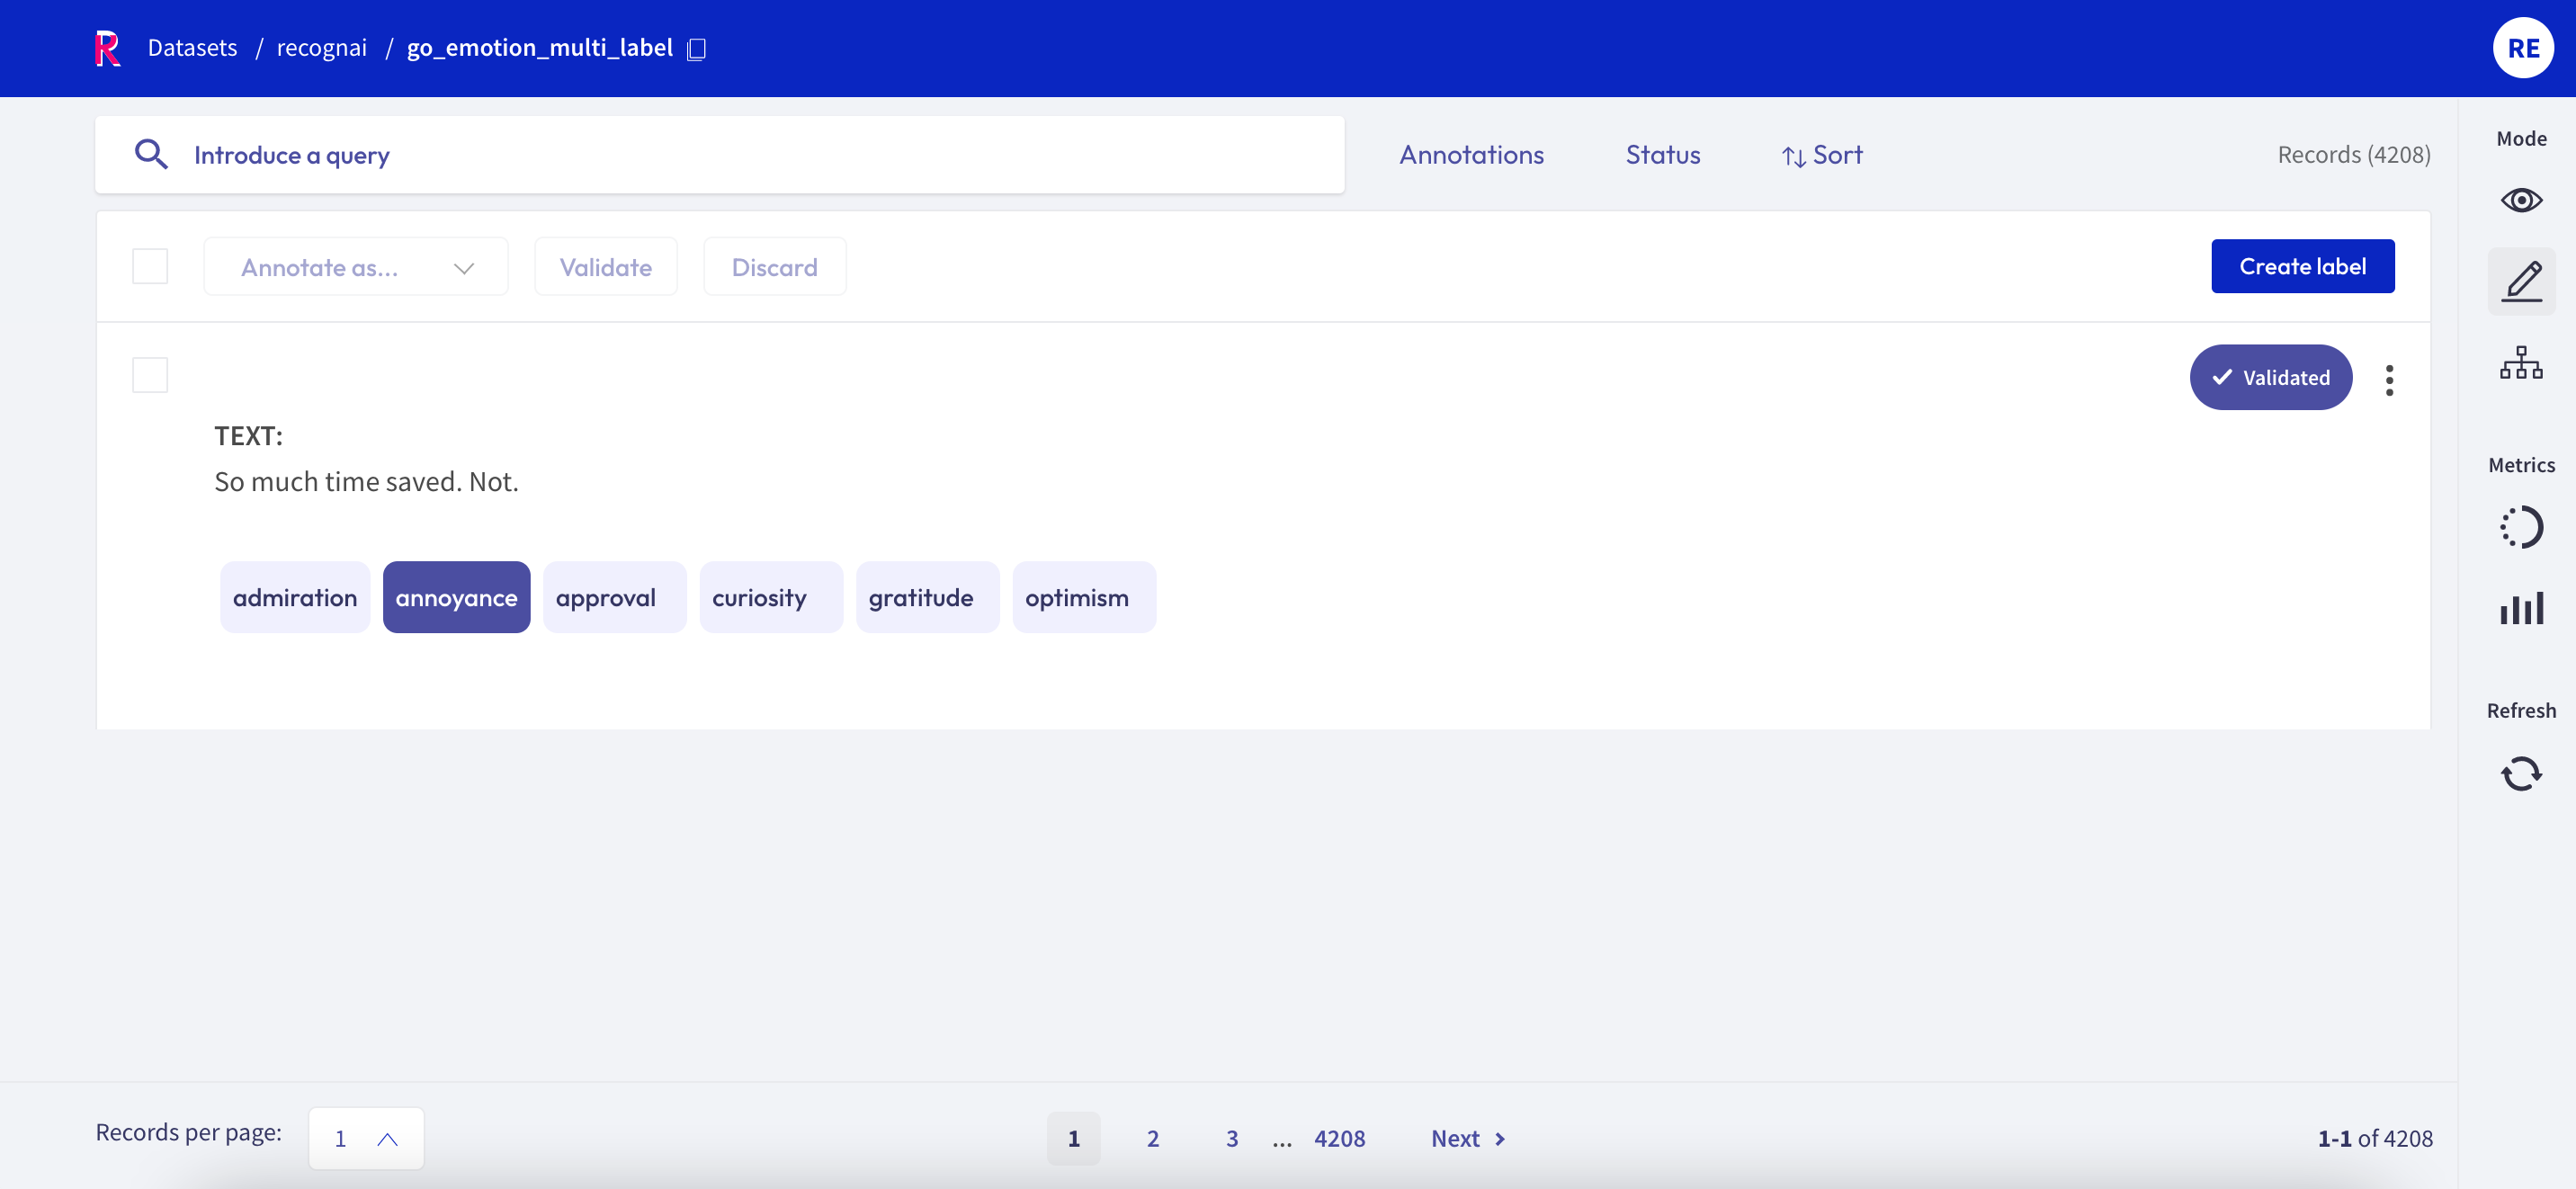
In this task the predictions are given as tags below the input text. They contain the label as well as a percentage score. When in Explore mode annotations are shown as tags on the right together with a symbol indicating if the predictions match the annotations or not. When in Annotate mode predictions and annotations share the same labels (annotation labels are darker).
A text classification dataset can support either single-label or multi-label classification - in other words, records are either annotated with one single label or various.
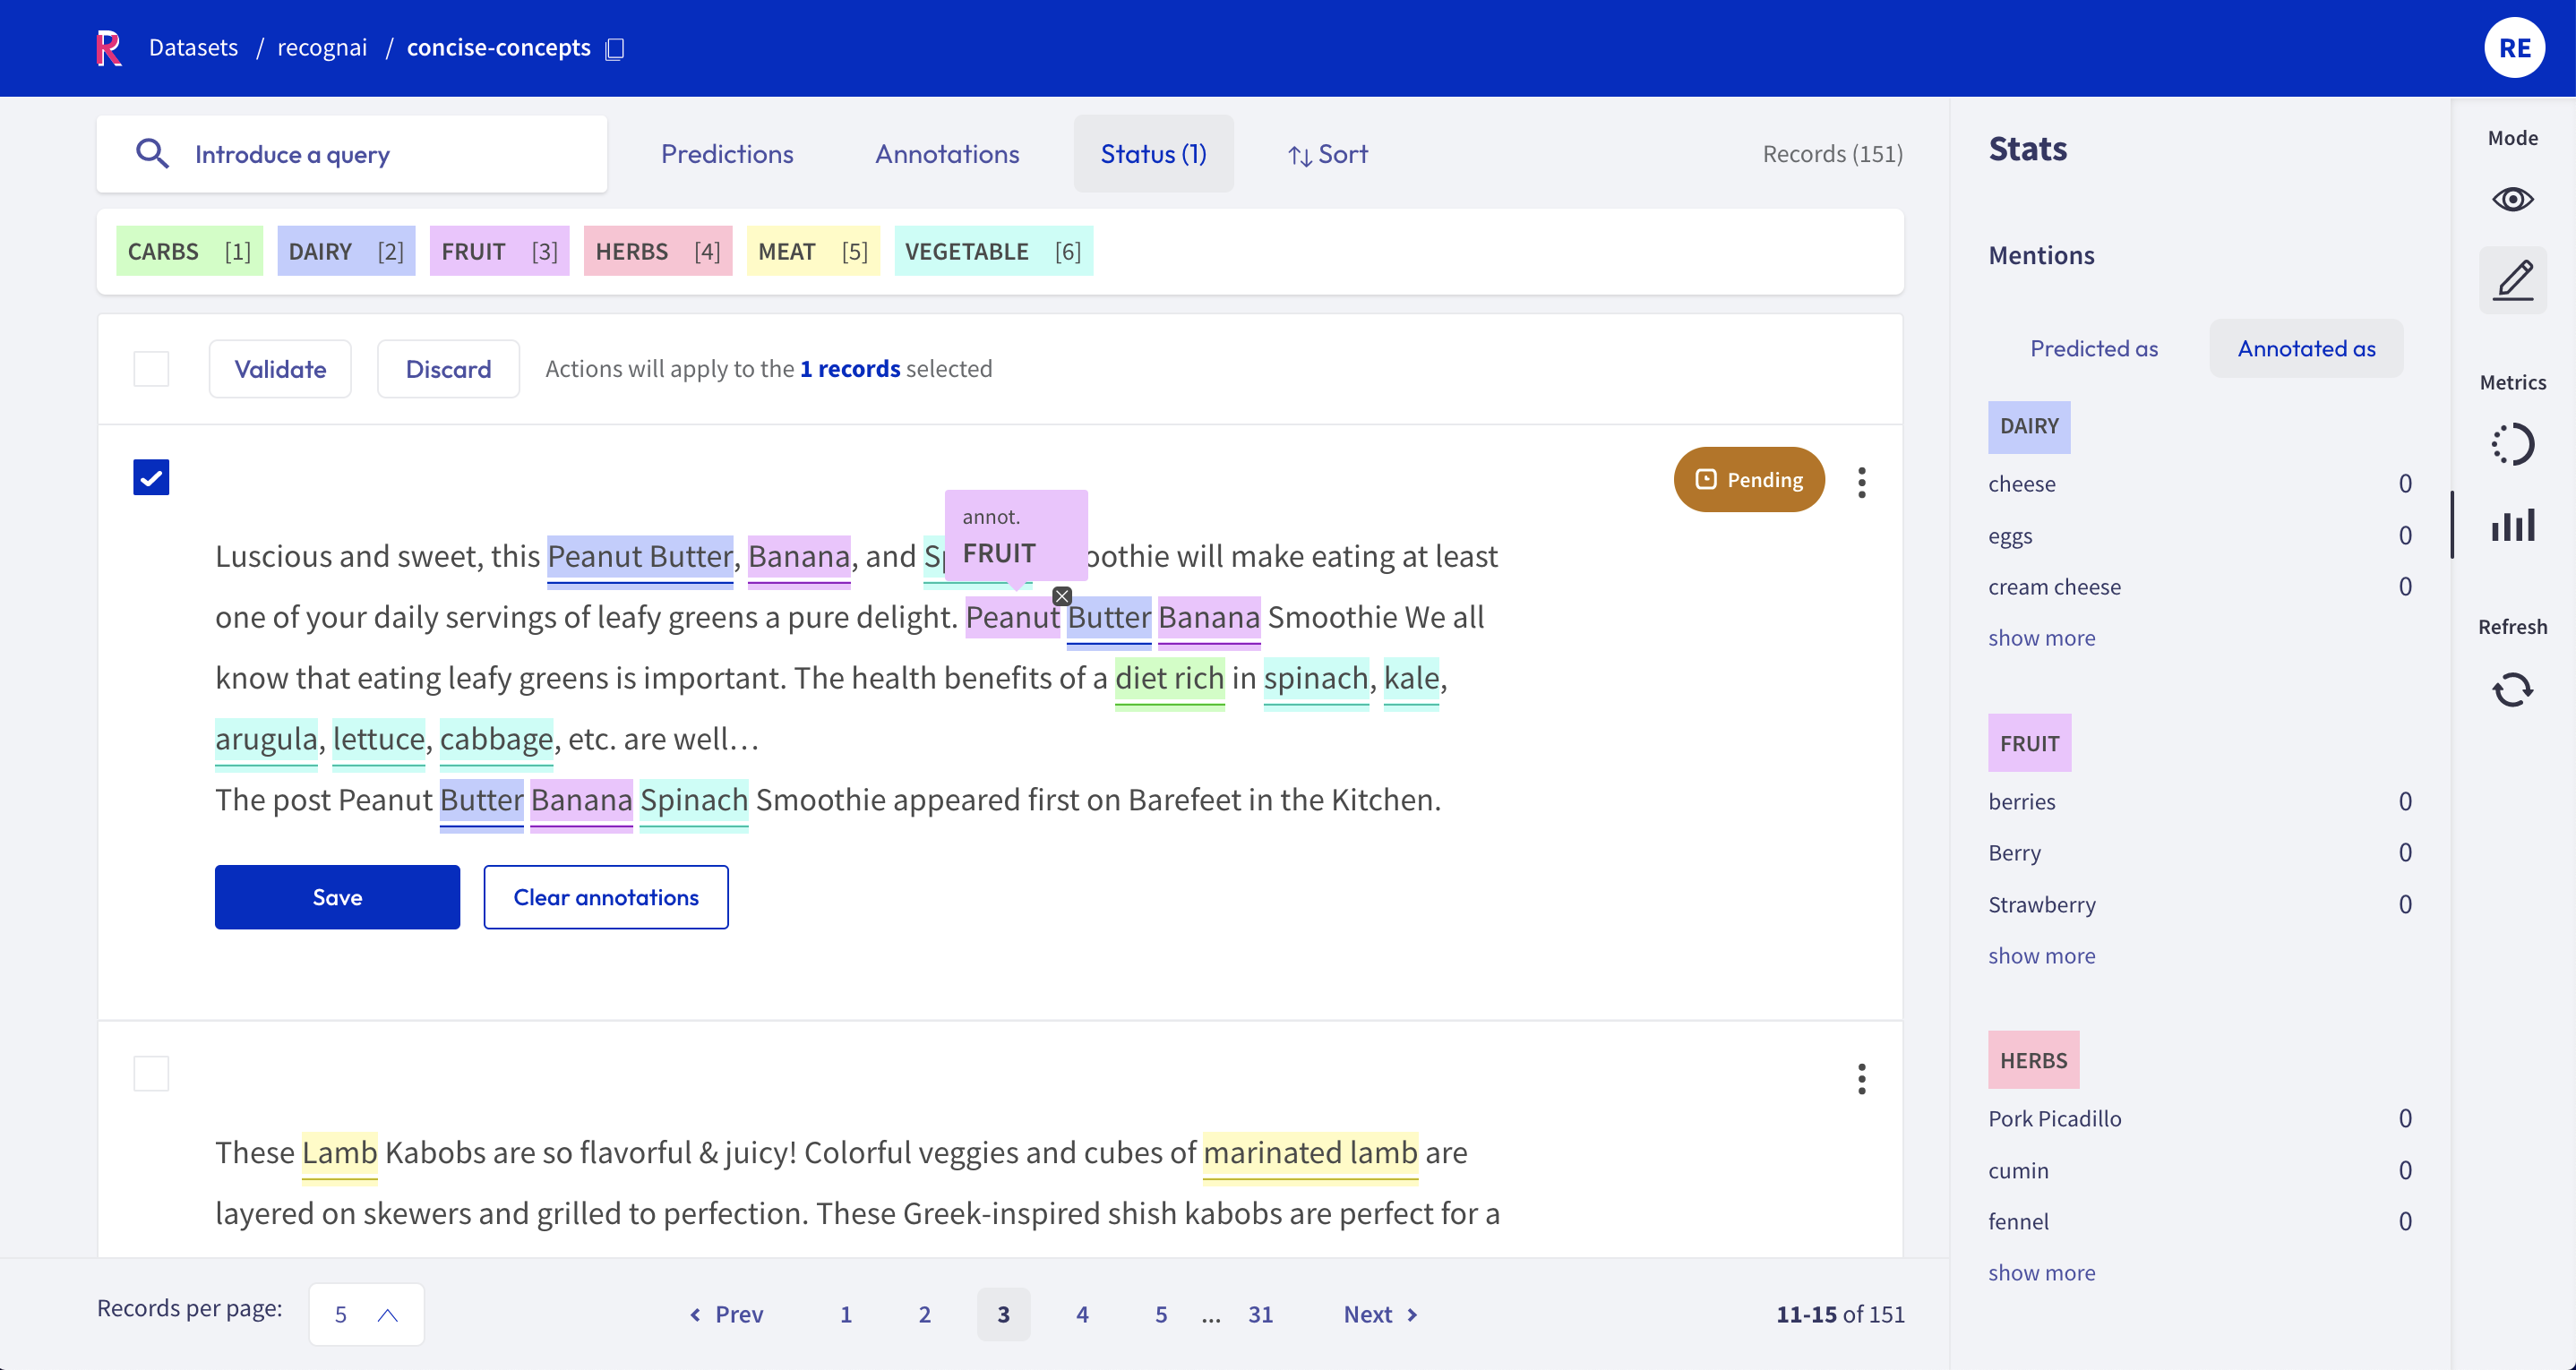
Token classification#
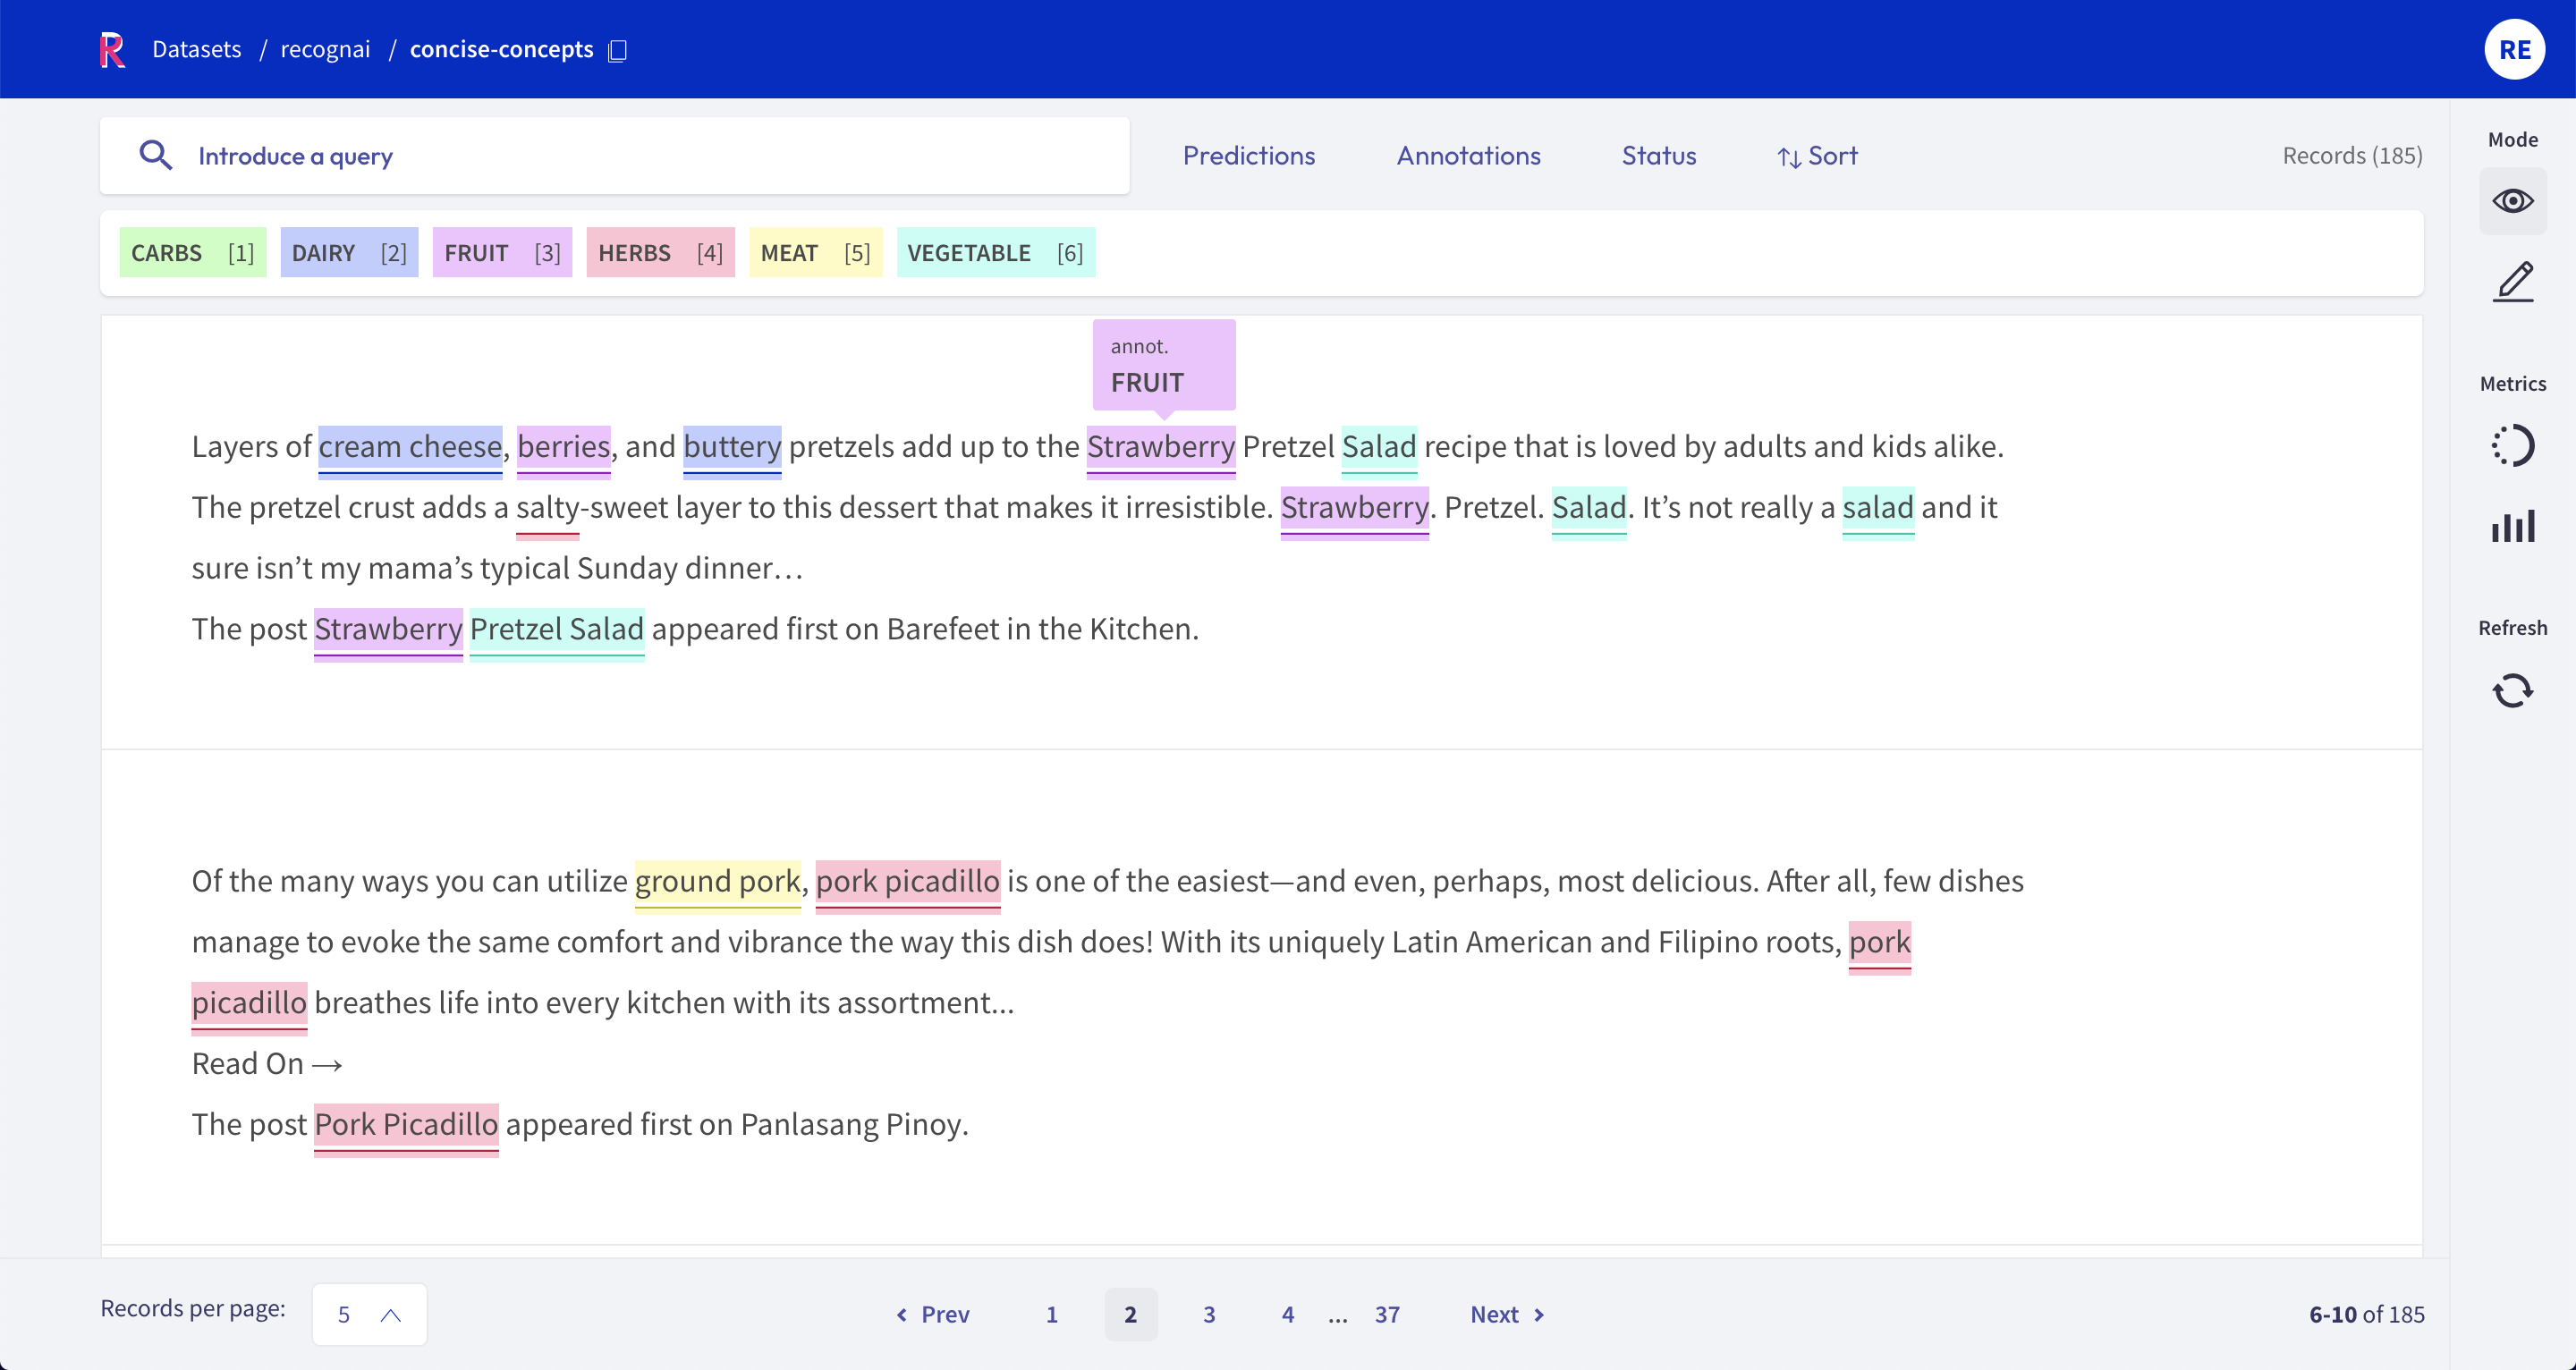
In this task annotations are given as colored highlights in the input text, while predictions are indicated by underlines. At the top of the record list you will find a legend that connects the colors to the respective labels. When in Annotate mode you can remove annotations or add new ones by simply selecting the desired text.
Hint
When using the score filter, the predictions that do not fall in the selected range will be missing the solid thin line.
Text2Text#
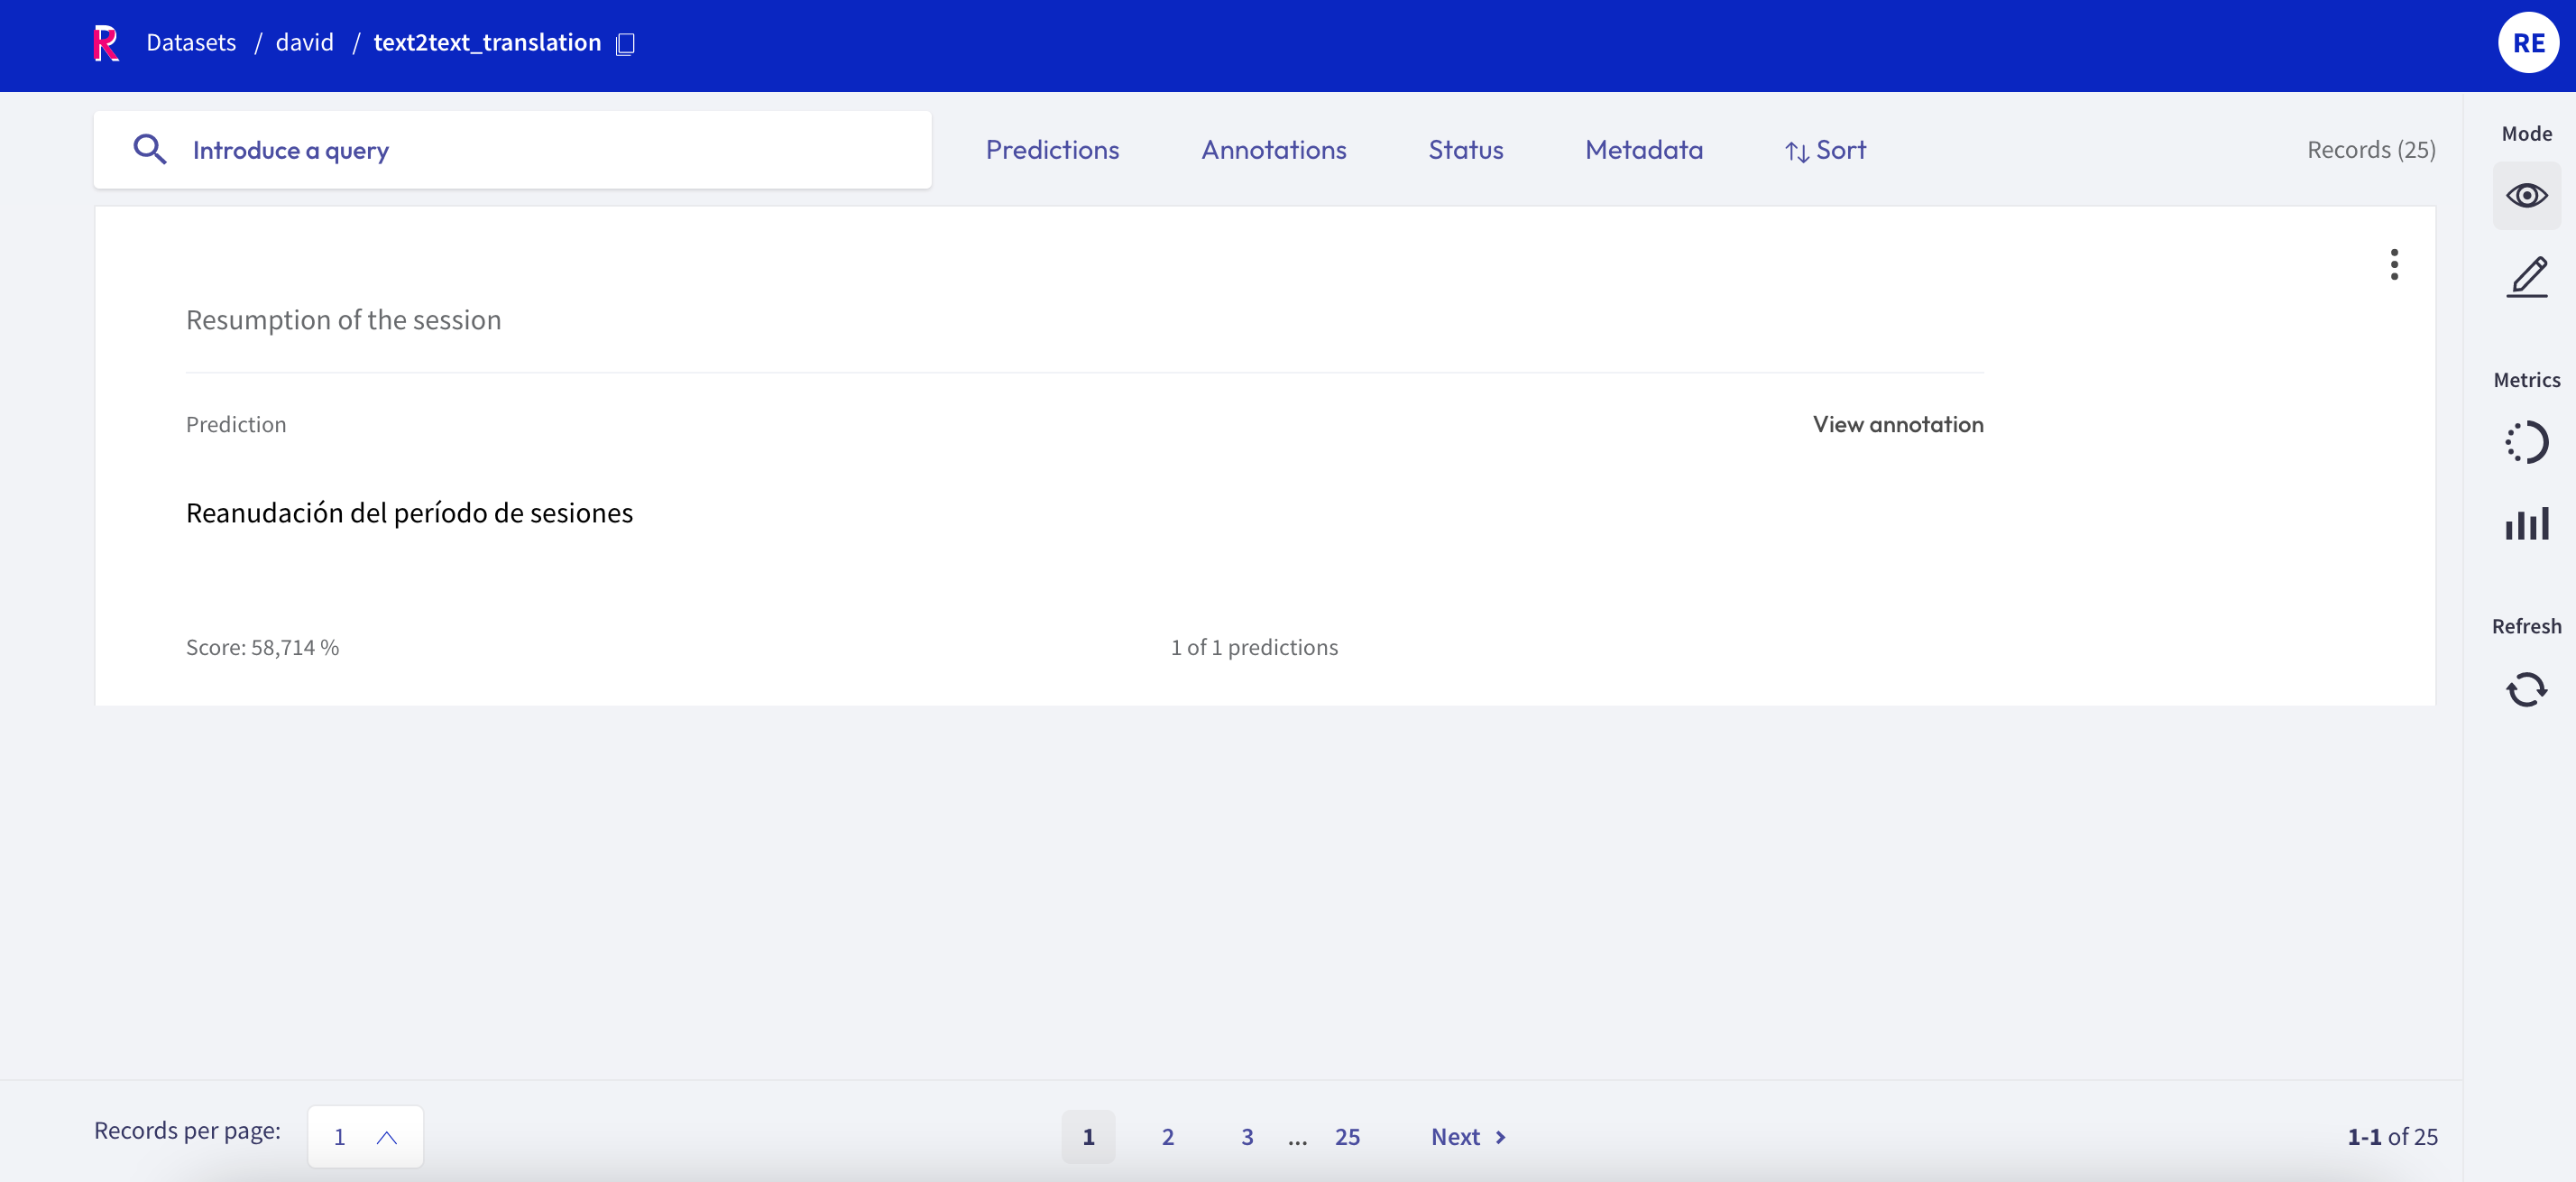
In this task predictions and the annotation are given in a text field below the input text. You can switch between prediction and annotation via the “View annotation”/”View predictions” buttons. For the predictions you can find an associated score in the lower left corner. If you have multiple predictions you can toggle between them using the arrows on the button of the record card.
Sidebar#
The right sidebar is divided into three sections.
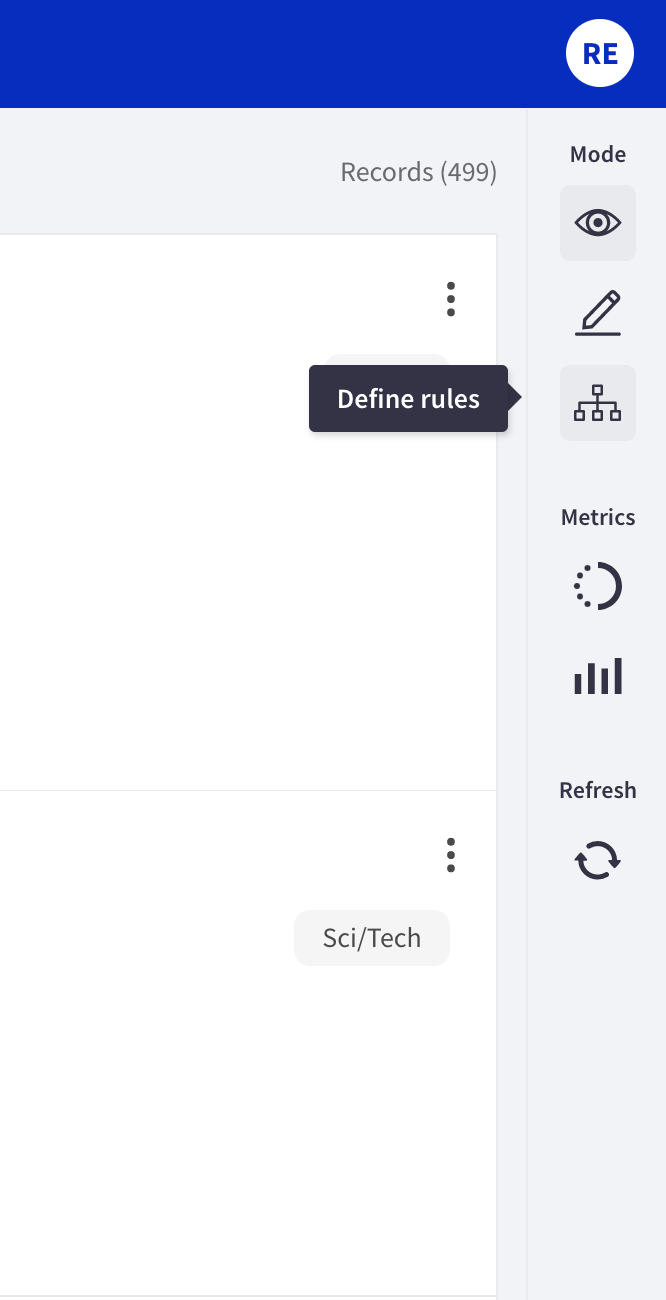
Modes#
This section of the sidebar lets you switch between the different Rubrix modes that are covered extensively in their respective guides:
Explore: this mode is for exploring your dataset and gain valuable insights
Annotate: this mode lets you conveniently annotate your data
Define rules: this mode helps you to define rules to automatically label your data
Note
Not all modes are available for all tasks.
Metrics#
In this section you find several “metrics” that can provide valuable insights to your dataset. They also provide some support while annotating your records, or defining heuristic rules. There are three different kind of metrics:
Progress: see metrics of your annotation process, like its progress and the label distribution (only visible in the Explore and Annotate mode)
Overall rule metrics: see aggregated metrics about your defined rules (only visible in the Define rules mode)
Stats: check the keywords of your dataset (text classification, text2text) or the mentions of your annotations and predictions (token classification)
You can find more information about each metric in our dedicated metrics guide.
Refresh#
This button allows you to refresh the list of the record cards with respect to the activated filters. For example, if you are annotating and use the Status filter to filter out annotated records, you can press the Refresh button to hide the latest annotated records.