Monitoring NLP pipelines
Rubrix currently gives users several ways to monitor and observe model predictions.
This brief guide introduces the different methods and expected usages.
Using rb.monitor
For widely-used libraries Rubrix includes an “auto-monitoring” option via the rb.monitor method. Currently supported libraries are Hugging Face Transformers and spaCy, if you’d like to see another library supported feel free to add a discussion or issue on GitHub.
rb.monitor will wrap HF and spaCy pipelines so every time you call them, the output of these calls will be logged into the dataset of your choice, as a background process, in a non-blocking way. Additionally, rb.monitor will add several tags to your dataset such as the library build version, the model name, the language, etc. This should also work for custom (private) pipelines, not only the Hub’s or official spaCy models.
It is worth noting that this feature is useful beyond monitoring, and can be used for data collection (e.g., bootstrapping data annotation with pre-trained pipelines), model development (e.g., error analysis), and model evaluation (e.g., combined with data annotation to obtain evaluation metrics).
Let’s see it in action using the IMDB dataset:
[ ]:
from datasets import load_dataset

dataset = load_dataset("imdb", split="test[0:1000]")
Hugging Face Transformer Pipelines
Rubrix currently supports monitoringtext-classification and zero-shot-classification pipelines, but token-classification and text2text pipelines will be added in coming releases.
[ ]:
from transformers import pipeline
import rubrix as rb

nlp = pipeline("sentiment-analysis", return_all_scores=True, padding=True, truncation=True)
nlp = rb.monitor(nlp, dataset="nlp_monitoring")

dataset.map(lambda example: {"prediction": nlp(example["text"])})
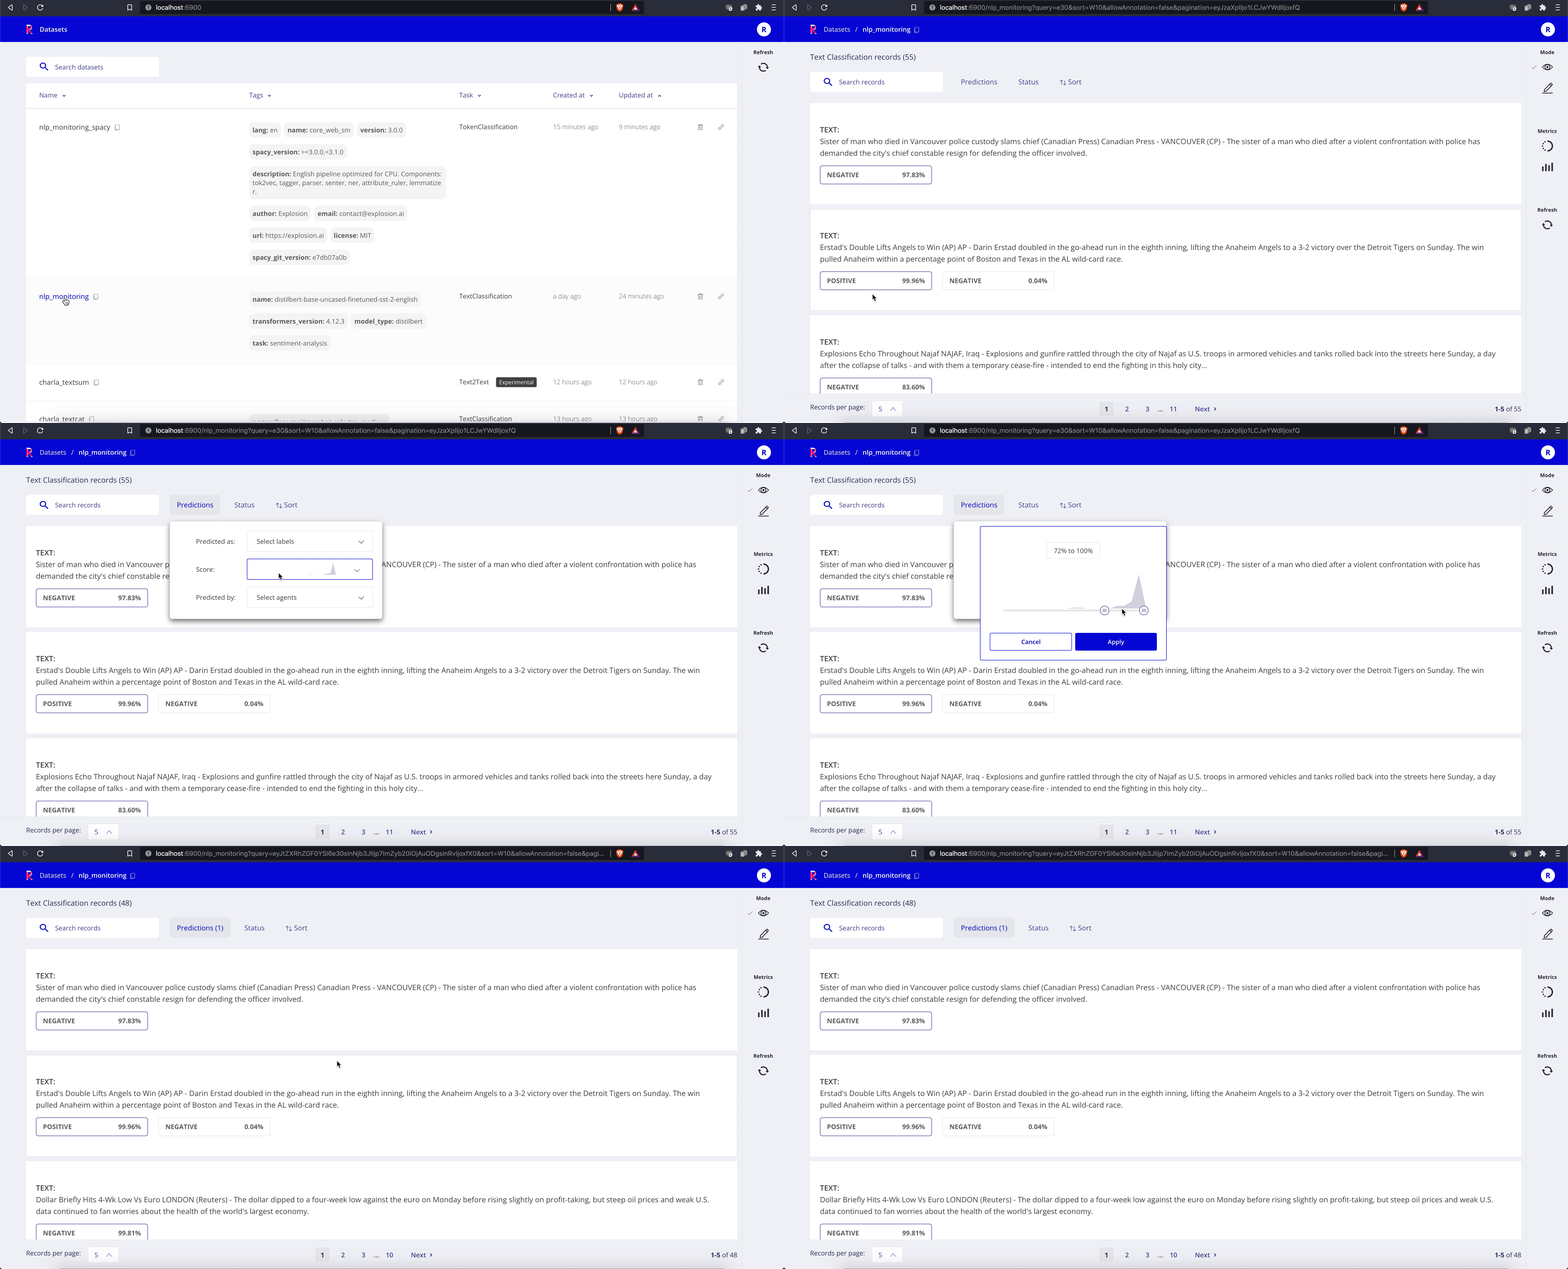
Once the map operation starts, you can start browsing the predictions in the Web-app:

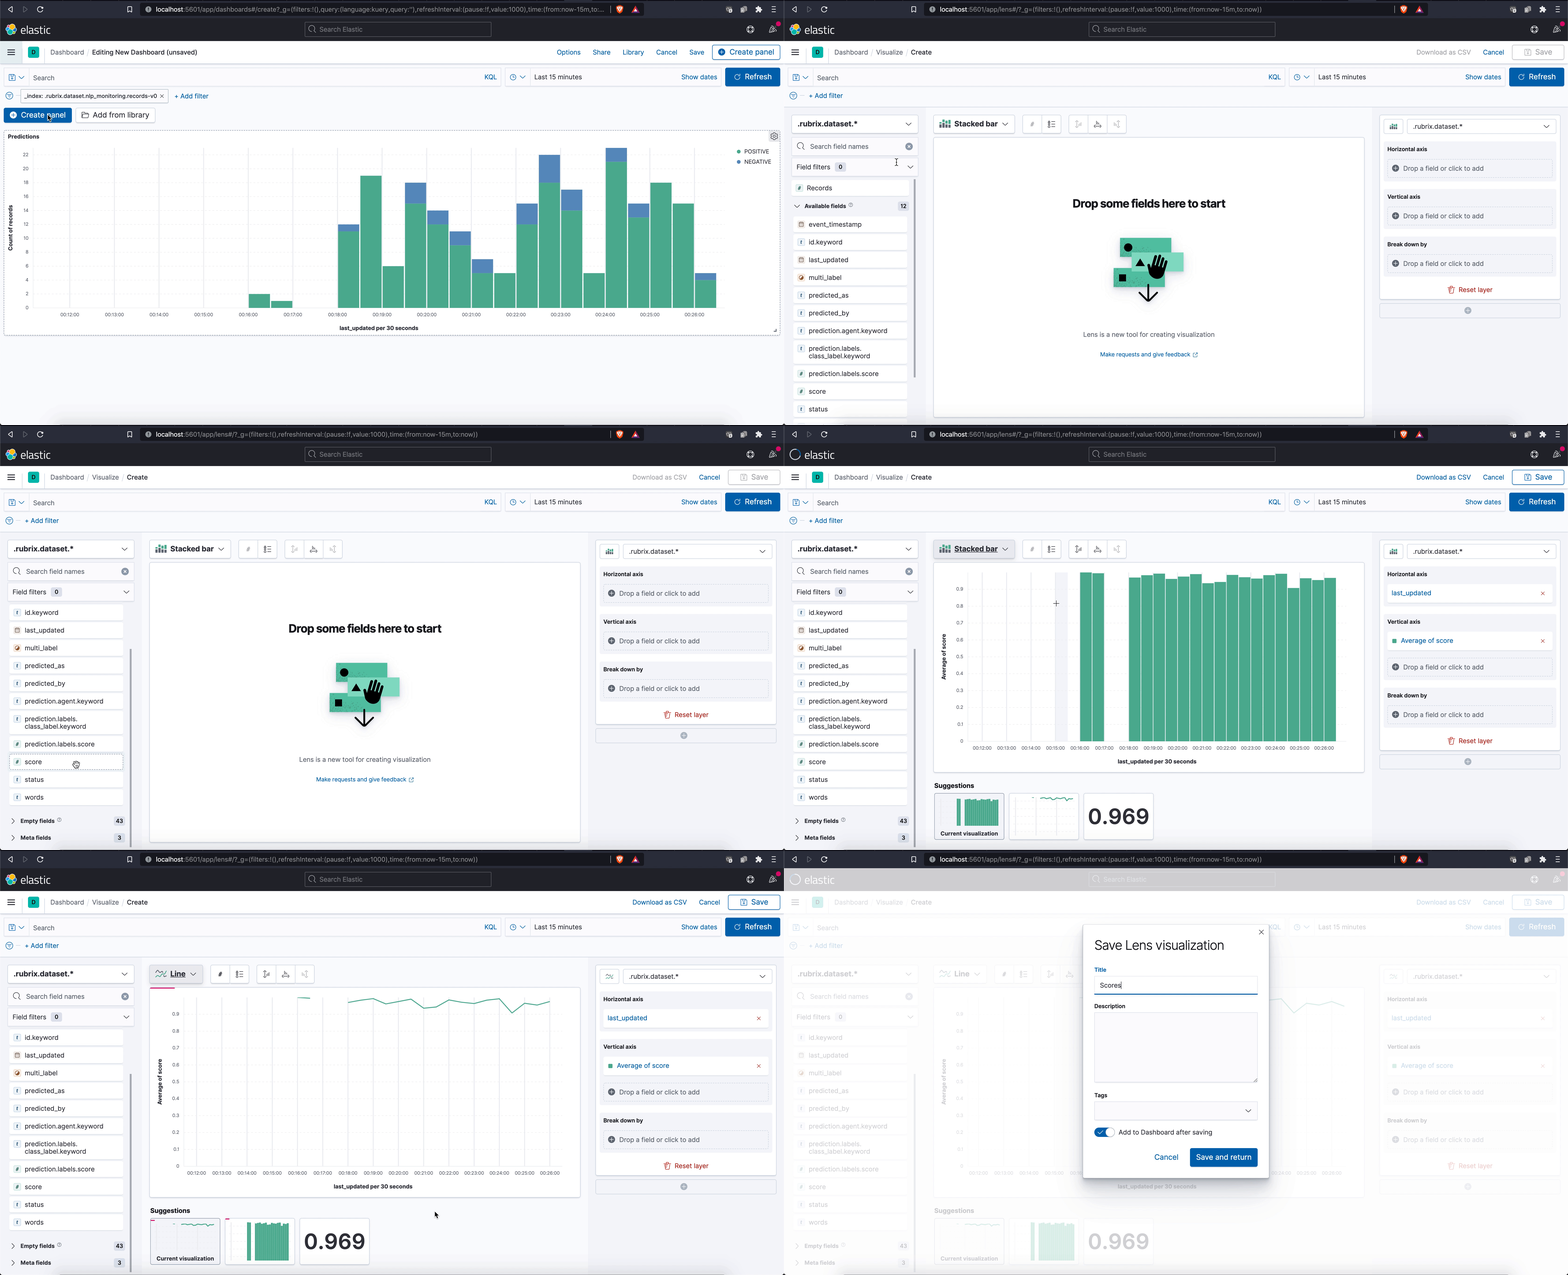
The default Rubrix installation comes with Kibana configured, so you can easily explore your model predictions and build custom dashboards (for your team and other stakeholders):

Record-level metadata is a key element of Rubrix datasets, enabling users to do fine-grained analysis and dataset slicing. Let’s see how we can log metadata while using rb.monitor. Let’s use the label in ag_news to add a news_category field for each record.
[ ]:
dataset
[ ]:
dataset.map(lambda example: {"prediction": nlp(example["text"], metadata={"news_category": example["label"]})})
spaCy
Rubrix currently supports monitoring the NER pipeline component, but textcat will be added soon.
[ ]:
import spacy
import rubrix as rb

nlp = spacy.load("en_core_web_sm")
nlp = rb.monitor(nlp, dataset="nlp_monitoring_spacy")

dataset.map(lambda example: {"prediction": nlp(example["text"])})
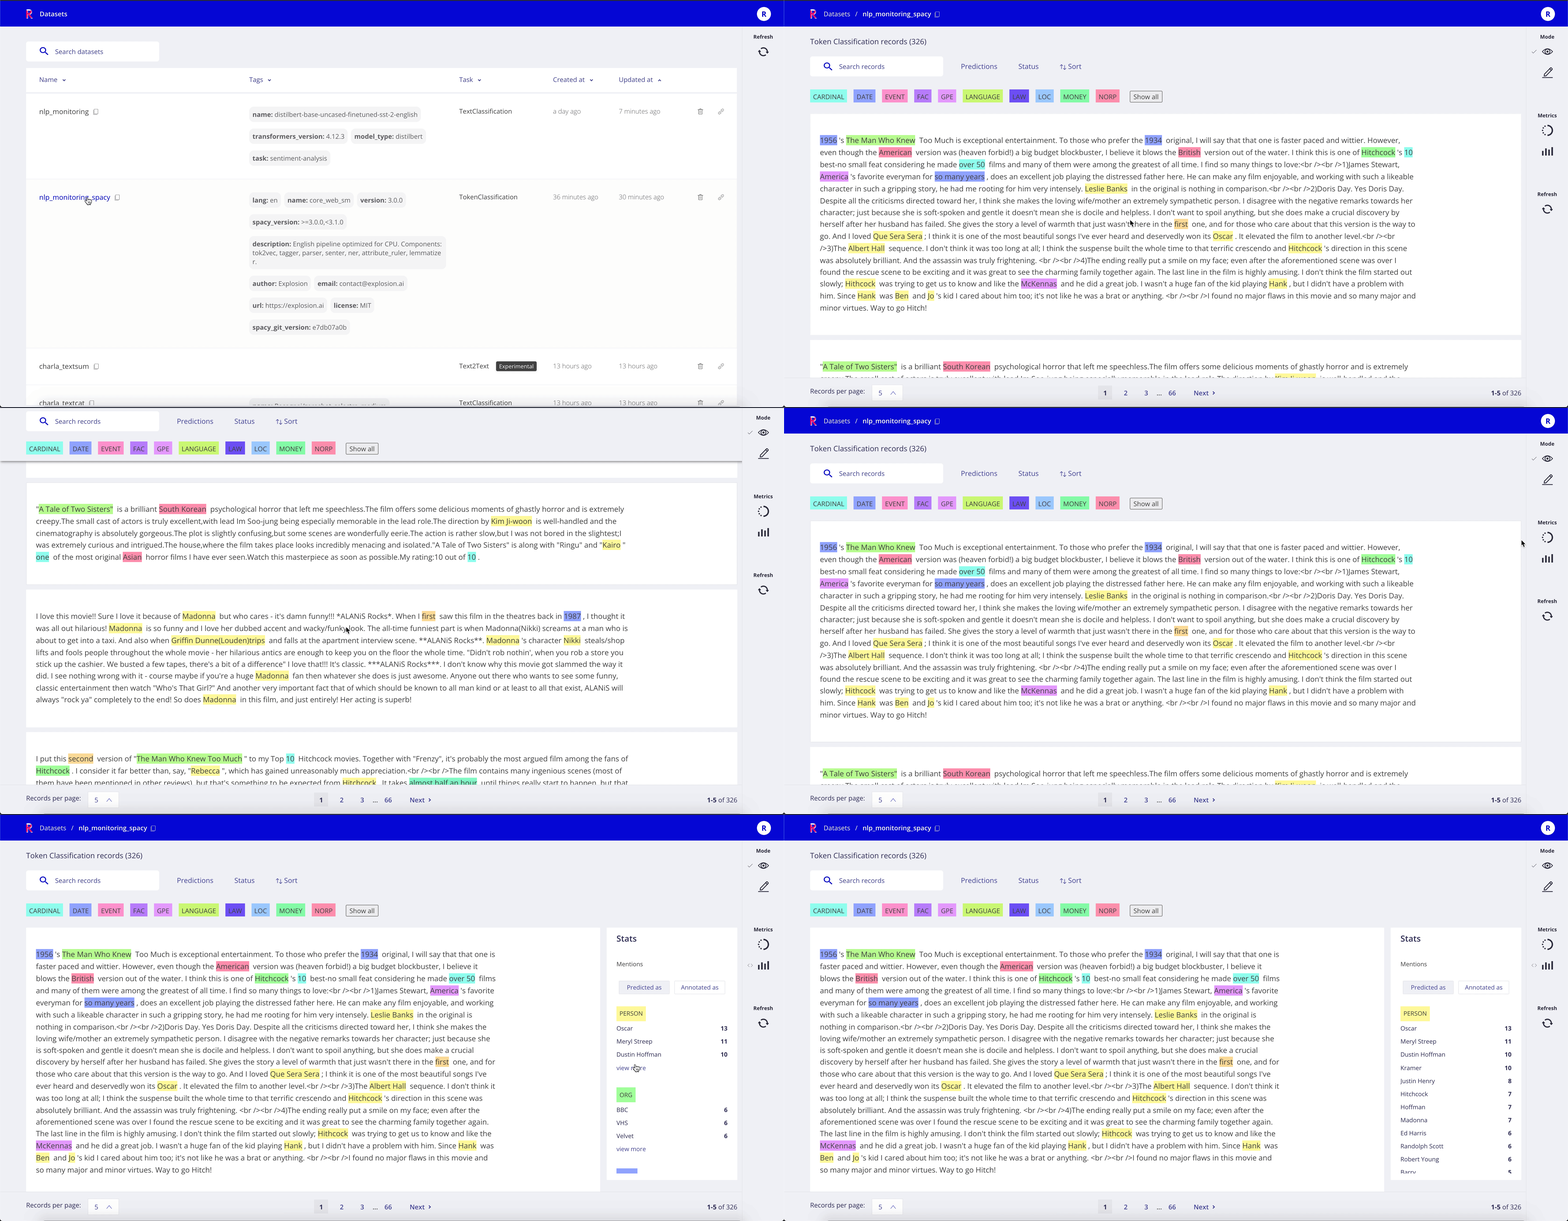
Once the map operation starts, you can start browsing the predictions in the Web-app:
