🕵️♀️ Analyzing predictions with model explainability methods#
In this tutorial you will learn to log and explore NLP model explanations using Transformers and the following libraries:
Transformers Interpret
Shap
Interpretability and explanation information in Rubrix is not limited to these two libraries. You can populate this information using your method of choice to highlight specific tokens.
This tutorial is useful to get started and understand the underlying structure of explanation information in Rubrix records.
Beyond browsing examples during model development and evaluation, storing explainability information in Rubrix can be really useful for monitoring and assessing production models (more tutorials on this soon!)
Let’s get started!
Setup#
Rubrix, is a free and open-source framework for data-centric NLP. If you are new to Rubrix, check out the Github repository ⭐.
If you have not installed and launched Rubrix yet, check the Setup and Installation guide.
Token attributions and what do highlight colors mean?#
Rubrix enables you to register token attributions as part of the dataset records. For getting token attributions, you can use methods such as Integrated Gradients or SHAP. These methods try to provide a mechanism to interpret model predictions. The attributions work as follows:
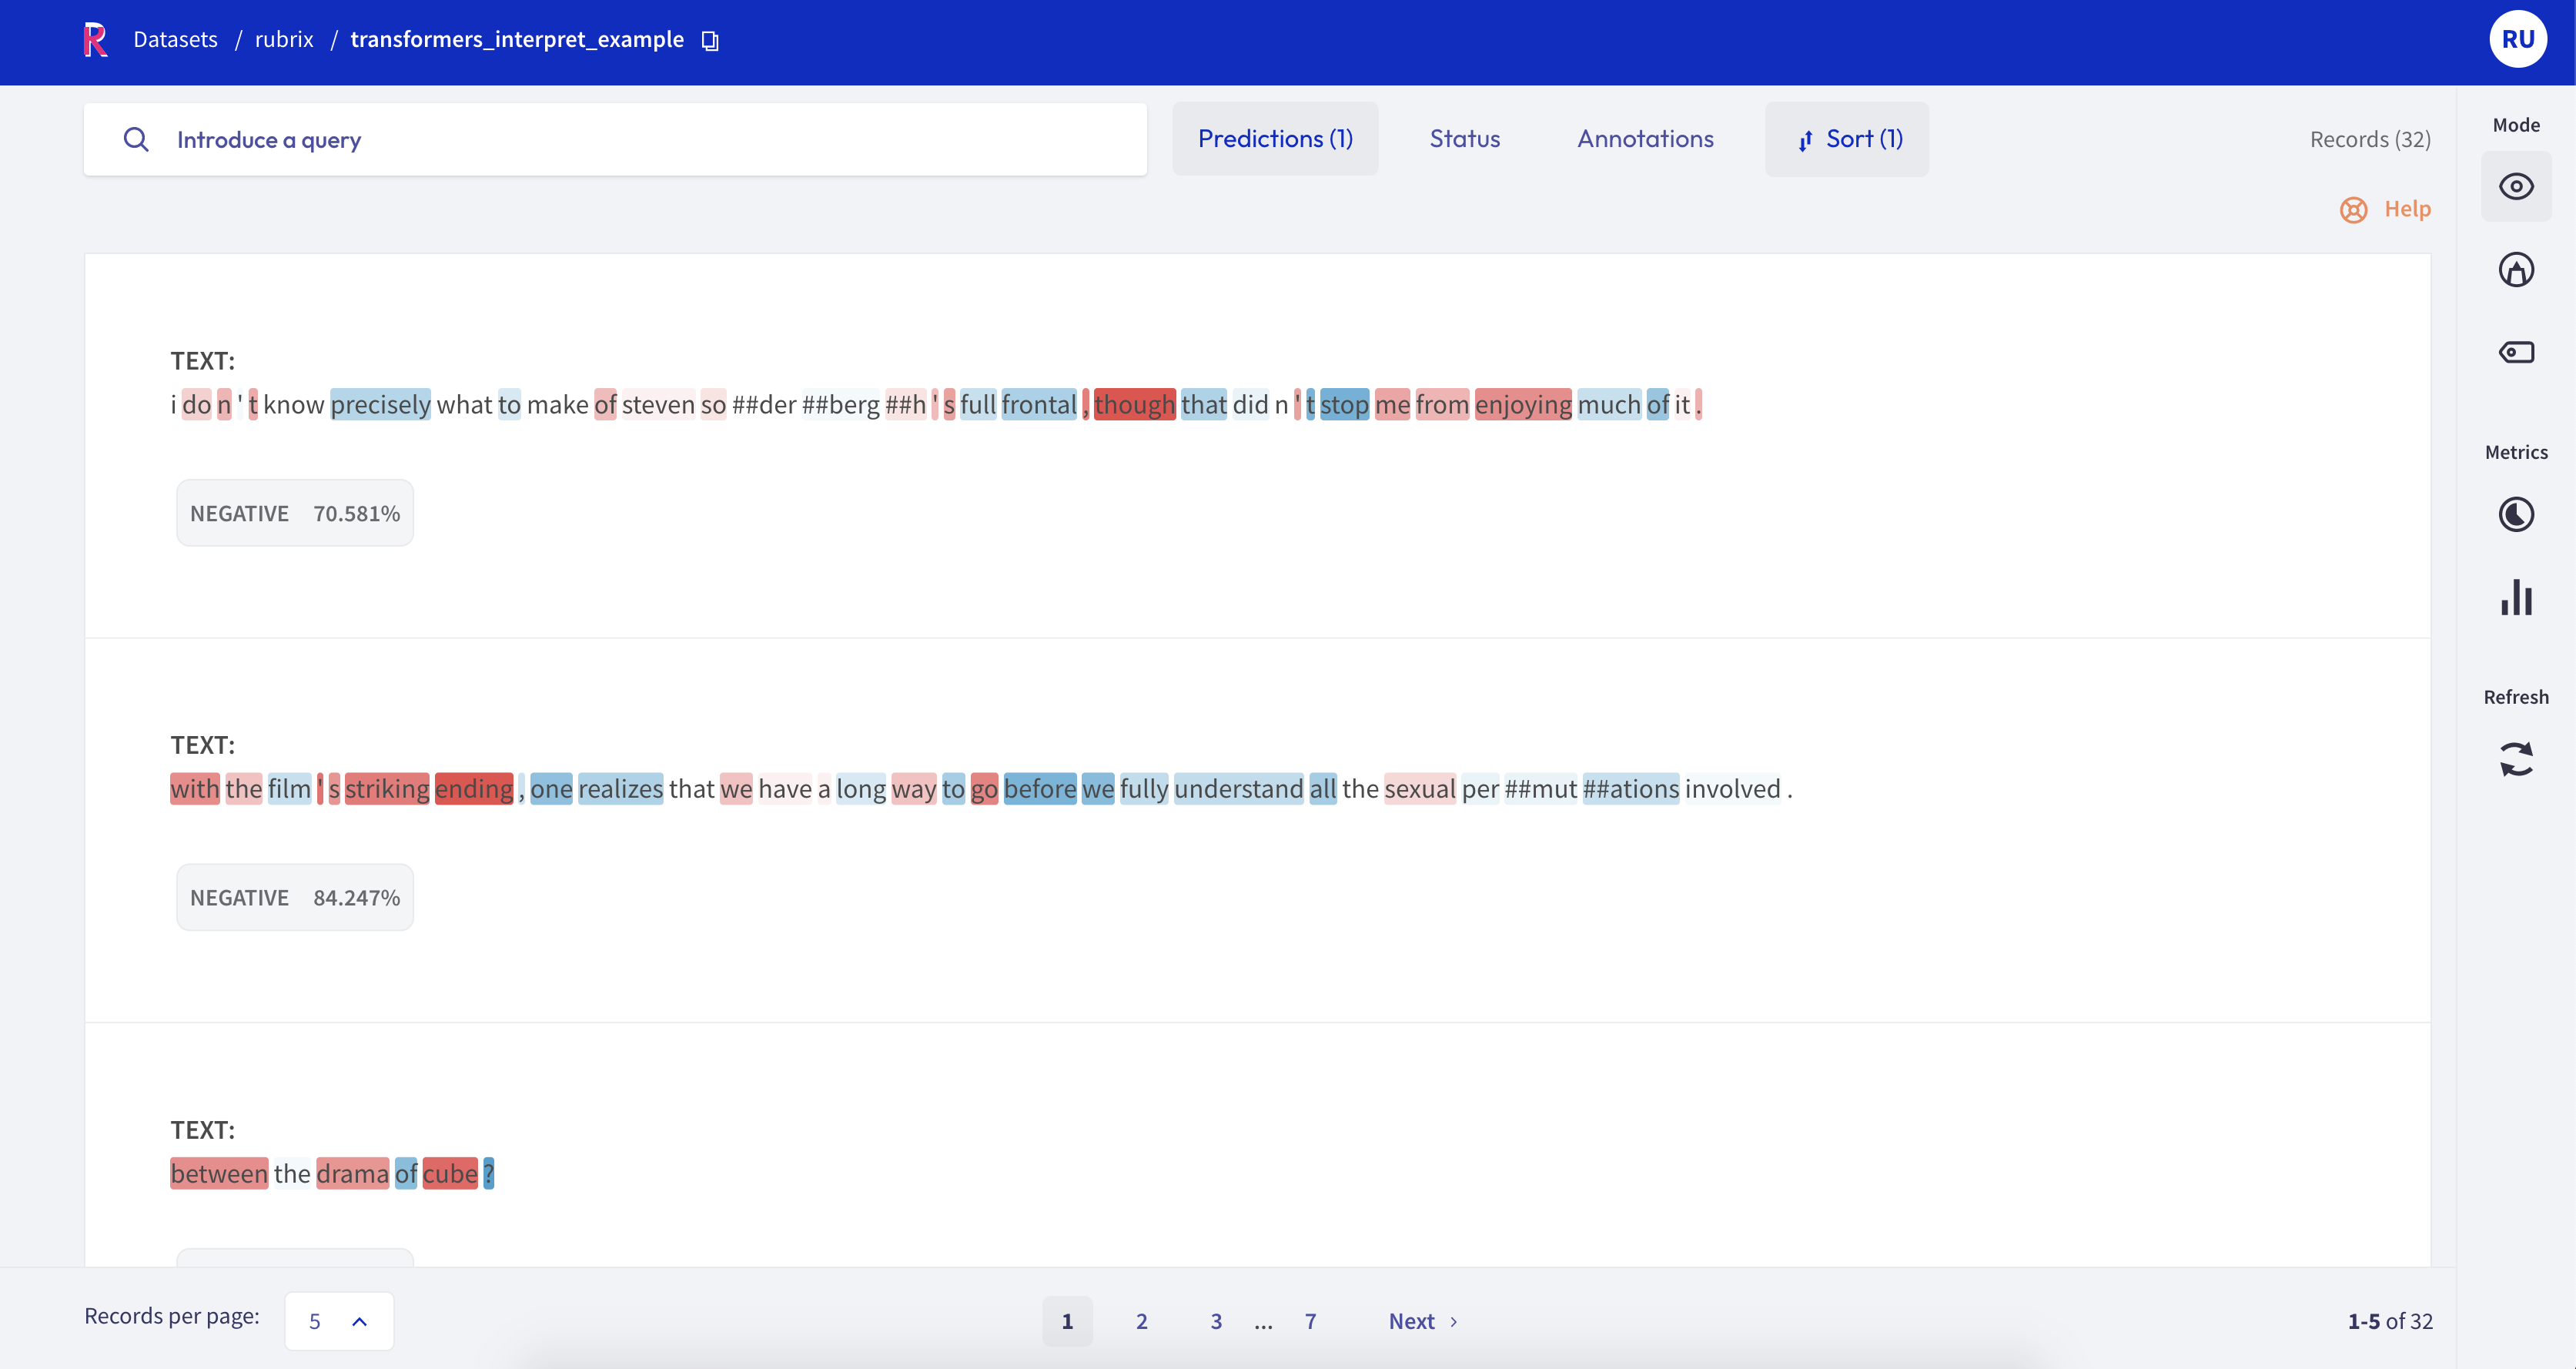
[0,1] Positive attributions (in blue) reflect those tokens that are making the model predict the specific predicted label.
[-1, 0] Negative attributions (in red) reflect those tokens that can influence the model to predict a label other than the specific predicted label.
Using Transformers Interpret#
In this example, we will use the sst sentiment dataset and a distilbert-based sentiment classifier. For getting model explanation information, we will use the excellent Transformers Interpret library by Charles Pierse.
Install dependencies#
[ ]:
!pip install transformers-interpret==0.5.2 datasets transformers
Create a fully searchable dataset with model predictions and explanations#
[ ]:
from transformers import AutoModelForSequenceClassification, AutoTokenizer
from transformers_interpret import SequenceClassificationExplainer
from datasets import load_dataset

import rubrix as rb
from rubrix import TokenAttributions

# Load Stanford sentiment treebank test set
dataset = load_dataset("sst", "default", split="test")

# Let's use a sentiment classifier fine-tuned on sst
model_name = "distilbert-base-uncased-finetuned-sst-2-english"
model = AutoModelForSequenceClassification.from_pretrained(model_name)
tokenizer = AutoTokenizer.from_pretrained(model_name)

# Define the explainer using transformers_interpret
cls_explainer = SequenceClassificationExplainer(model, tokenizer)

records = []
for example in dataset:

    # Build Token attributions objects
    word_attributions = cls_explainer(example["sentence"])
    token_attributions = [
        TokenAttributions(
            token=token,
            attributions={cls_explainer.predicted_class_name: score}
        ) # ignore first (CLS) and last (SEP) tokens
        for token, score in word_attributions[1:-1]
    ]
    # Build Text classification records
    record = rb.TextClassificationRecord(
        text=example["sentence"],
        prediction=[(cls_explainer.predicted_class_name, cls_explainer.pred_probs)],
        explanation={"text": token_attributions},
    )
    records.append(record)

# Build Rubrix dataset with interpretations for each record
rb.log(records, name="transformers_interpret_example")
Example: Predicted as negative sorted by descending score#
If you go to http://localhost:6900/datasets/rubrix/transformers_interpret_example (assuming you are running Rubrix on your local machine you get a fully-searchable dataset). For example, let’s drill down to look at examples predicted as negative with a low score:
Using Shap#
In this example, we will use the widely-used Shap library by Scott Lundberg.
Install dependencies#
[ ]:
!pip install shap==0.40.0 numba==0.53.1
Create a fully searchable dataset with model predictions and explanations#
This example is very similar to the one above. The main difference is that we need to scale the values from Shap to match the range required by Rubrix UI. This restriction is for visualization purposes. If you are more interested in monitoring use cases you might not need to rescale.
[ ]:
import transformers
from datasets import load_dataset

from sklearn.preprocessing import MinMaxScaler

import shap

from rubrix import TextClassificationRecord, TokenAttributions
import rubrix as rb

# Transformers pipeline model
model = transformers.pipeline("sentiment-analysis", return_all_scores=True)

# Load Stanford treebank dataset only the first 5 records for testing
sst = load_dataset("sst", split="test[0:5]")

# Use shap's library text explainer
explainer = shap.Explainer(model)
shap_values = explainer(sst['sentence'])

# Instantiate the scaler
scaler = MinMaxScaler(feature_range=[-1, 1])

predictions = model(sst["sentence"])

for i in range(0, len(shap_values.values)):

    # Scale shap values betweeen -1 and 1 (using e.g., scikit-learn MinMaxScaler
    scaled = scaler.fit_transform(shap_values.values[i])

    # get prediction label idx for indexing attributions and shap_values
    # sorts by score to get the max score prediction
    sorted_predictions = sorted(predictions[i], key=lambda d: d["score"], reverse=True)
    label_idx = 0 if sorted_predictions[0]["label"] == "NEGATIVE" else 1

    # Build token attributions
    token_attributions = [
        TokenAttributions(
            token=token, attributions={shap_values.output_names[label_idx]: score}
        )
        for token, score in zip(shap_values.data[i], [row[label_idx] for row in scaled])
    ]

    # Build Rubrix record
    record = TextClassificationRecord(
        inputs=sst["sentence"][i],
        prediction=[(pred["label"], pred["score"]) for pred in predictions[i]],
        explanation={"text": token_attributions},
    )
    # Log record
    rb.log(record, name="rubrix_shap_example")